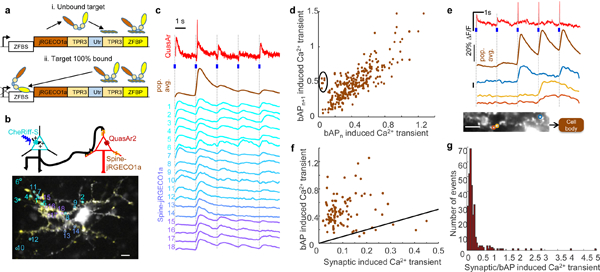
Figure 3. Simultaneous presynaptic optogenetic stimulation, spine Ca2+ imaging and somatic voltage imaging.

(a) Design of spine-targeted jRGECO1a. (i) TPR3 linkers linked jRGECO1a, Utrophin (Utr), and a zinc finger DNA binding protein (ZFBP). (ii) Upon saturation of actin binding of spine-jRGECO1a, unbound protein accumulated in the nucleus where it bound the zinc finger binding site (ZFBS) downstream of the transcriptional start site and thereby blocked transcription. (b) Top: Schematic showing three color imaging with blue light excitable soma-localized CheRiff in presynaptic cells, yellow light excitable spine-jRGECO1a and red light excitable QuasAr2 co-expressed in postsynaptic cells. Bottom: spine-jRECO1a channel overlaid with active spines colored in yellow. Active spines are circled and numbered with correspondingly colored traces in (c). (c) Blue: 10 ms blue light stimulation of soma-localized CheRiff. Red: QuasAr2 fluorescence. Orange: population average of spine-jRGECO1a fluorescence over all the spines. Cyan-purple: spine-jRGECO1a fluorescence in individual spines. Dashed lines mark stimulus times. (d) Scatter plot of spine Ca2+ transients (ΔF) in pairs of successive bAPs. Transient amplitudes were predominantly correlated between events (R2 = 0.66, n = 100 spines, 3 bAPs) but some spines showed failures on some events (circled). (e) bAP failure in spines. Blue: 10 ms blue light stimulation of soma-localized CheRiff. Red: QuasAr2 fluorescence; orange: population average of spine-jRGECO1a over all the spines. Bottom: three spines on the same dendritic branch showed occasional bAP failures. (f) Scatter plot of bAP induced Ca2+ transients vs. PSP induced Ca2+ transients (R2 = 0.005, n = 100 spines). Black line indicates slope 1, corresponding to equal magnitude. (g) Histogram of the ratio of Ca2+ transient amplitudes driven by bAPs vs. synaptic events. All scale bars 15 μm.
