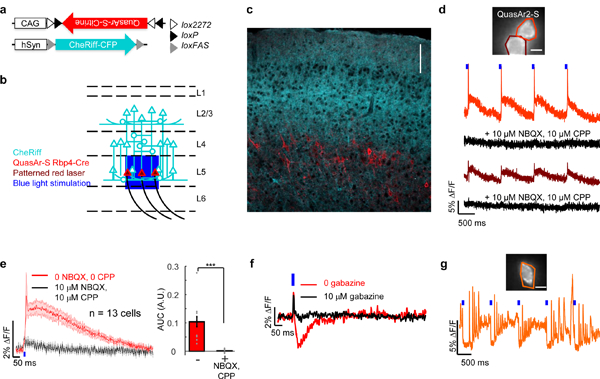
Figure 4. SynOptopatch detected EPSPs and IPSPs in acute mouse brain slice.

(a), (b) Schematic showing experimental design. Rbp4-Cre mice were injected with hSyn-Cre-off CheRiff-CFP and CAG-Cre-on soma-localized QuasAr (QuasAr-S) leading to QuasAr-S expression in Layer 5 pyramidal neurons and CheRiff expression throughout the cortex. (c) Confocal image of a fixed brain slice. Scale bar 100 μm. (n = 3 times; representative data are shown) (d) Top: Fluorescence of QuasAr-S. Bottom: fluorescence traces of the two circled cells before (red) and after (black) addition of NBQX (10 μM) and CPP (10 μM). (n = 13 cells; representative data are shown) (e) Average PSPs of 13 cells before (red) and after NBQX and CPP (black). Shaded error bars, s.e.m. Right: quantification of AUC before and after addition of NBQX and CPP (0.1 ± 0.017 A.U. vs 0.002 ± 0.002 A.U., n = 13 neurons, ***p = 1×10⁻⁴, two-sided paired-sample t-test). (f) IPSP before (red) and after 10 μM gabazine (black). Five-trial average. (n = 1 in 14 cells) (g) Single-trial IPSP detected under elevated (5 mM) extracellular K+ and 10 μM NBQX, 10 μM AP5. Scale bars in (d, g): 10 μm. (n = 8 cells; representative data are shown). All statistics are mean ± s.e.m.
