
Figure 5. Mechanistic analysis of ketamine-induced disinhibition.
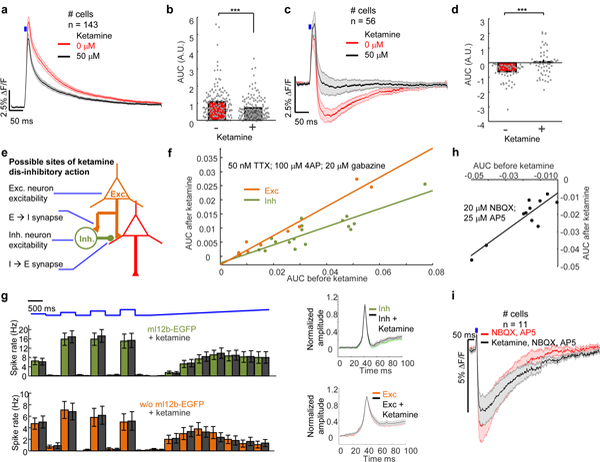
(a) For cells with pure EPSPs (red), ketamine (50 μM, black) decreased the slow component of the EPSP (n = 143 neurons). (b) Quantification of the AUC in (a) (***p = 2×10⁻⁶, two-tailed t-test). (c) For cells with mixed EPSP and IPSP, the mean IPSP decreased after ketamine addition (n = 56 neurons). (d) Quantification of AUC in (b). (***p = 3×10⁻⁶, two-tailed t-test). (e) Possible sites of ketamine disinhibitory action: glutamatergic synapses onto inhibitory neurons; intrinsic excitability of excitatory or inhibitory neurons; GABAergic synapses. (f) Under conditions of monosynaptic excitatory transmission (50 nM TTX, 100 μM 4-AP, 20 μM gabazine), ketamine (50 μM) induced a larger decrement in the EPSP in inhibitory neurons (green, n = 17 neurons) than in excitatory neurons (orange, n = 10 neurons). ANCOVA analysis comparing the slopes, p = 0.001. (g) Left: In inhibitory neurons (green) the mean firing rate during a series of optogenetic stimuli was 12.9 ± 2.2 Hz before ketamine and 13.4 ± 2.2 Hz after ketamine (n = 27 neurons, p = 0.86). In excitatory neurons (orange) the mean firing rate was 5.1 ± 1.1 Hz before ketamine and 5.1 ± 1.1 Hz after ketamine (n = 22 neurons, p = 0.98). Right: In inhibitory neurons (green) the mean AP width before ketamine was 6.9 ± 0.3 ms, and after ketamine it was 6.8 ± 0.3 ms (n = 27 neurons, p = 0.81, two-sided paired-sample t-test). In excitatory neurons (orange) the mean AP width before ketamine was 9.3 ± 0.5 ms, and after ketamine it was 8.2 ± 0.8 ms (n = 22 neurons, p = 0.30, two-sided paired-sample t-test). (h) Effect of ketamine on inhibitory transmission. IPSPs were probed in the presence of NBQX (20 μM) and AP5 (25 μM). Regression fit of AUC before and after ketamine of inhibitory synaptic transmission (slope = 0.72 ± 0.12, R2 =0.8, n = 11 neurons). (i) Red: IPSP before ketamine. Black: IPSP after ketamine. All shaded error bars and error bars, s.e.m. All statistics are mean ± s.e.m.