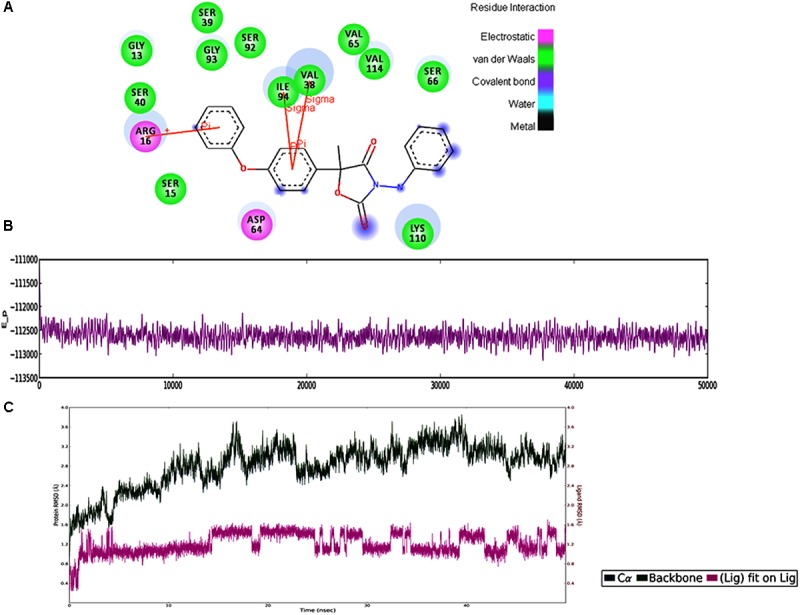
FIGURE 10.

(A) The 2D representation for the docked complex of the FOXG_04696. The figure showed the putative residues involved in interaction with Famoxadone. The different colors have been used for showing the different types of molecular interactions involved. (B) MD simulations trajectories for the FOXG_04696–Famoxadone complex showing the average potential energies of the docked complexes during the 50-ns MD simulations. (C) Plot of the root mean square deviation (RMSD) of Cα of T4HNR (protein) and the FOXG_04696–Famoxadone (complex). RMSDs were calculated using the initial structures as templates.
