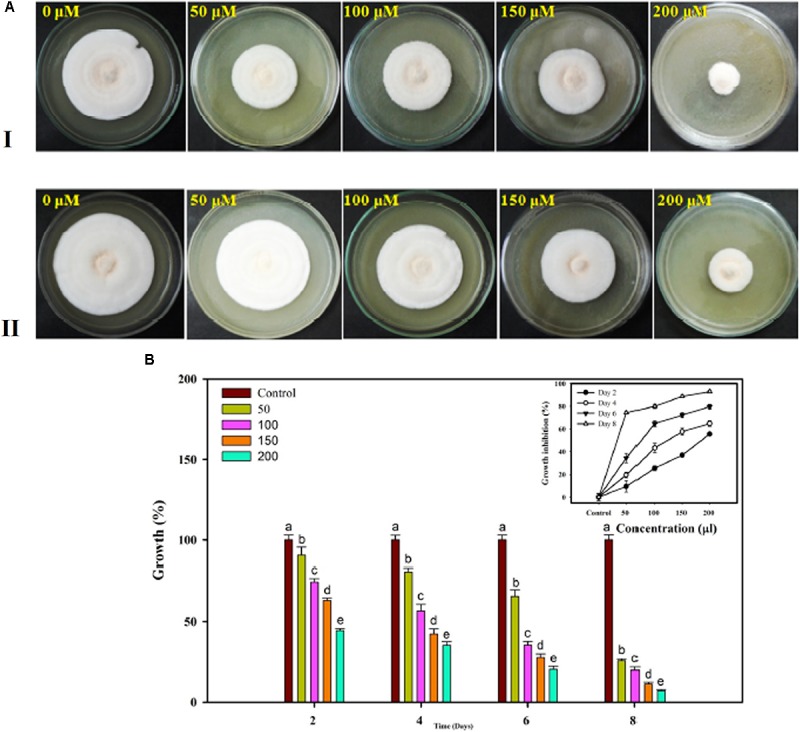
FIGURE 13.

In vitro assessment of the fungicide on growth response of FOL pathogen. Four different concentrations were selected 50, 100, 150, and 200 μL along with control at 4 days interval (A-I) and at 8 days interval (A-II). (B) The growth was recorded at even day’s interval (2, 4, 6, and 8) and the percentage inhibition was calculated using statistical tools.
