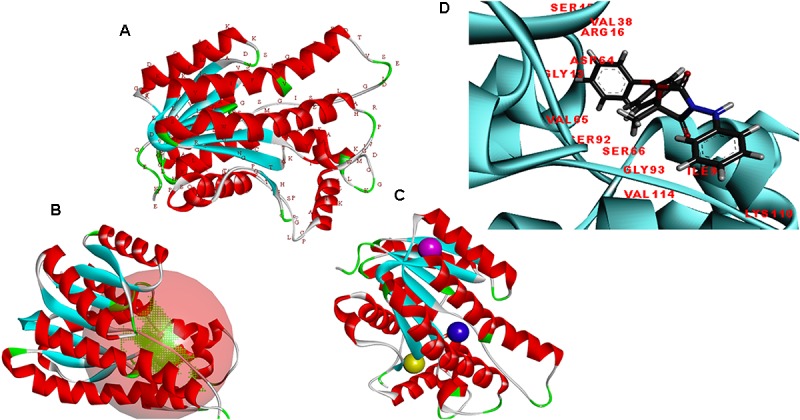
FIGURE 5.

(A) Predicted structure of the FOXG_04696 modeled through homology modeling using Modeller v9.19 and visualized through the Discovery Studio 3.0 visualization tool. (B) The big red sphere represents the cavities surrounding the active sites and was visualized using the visualization module of the Discovery studio 3.0. The three binding sites were explored through the meta-pocket server. (C) The three putative binding sites as shown through three different colored red balls. (D) General view of protein-ligand interaction showing the residues from the active site (FOXG_04696) residues involved in making interaction with ligand (fungicide).
