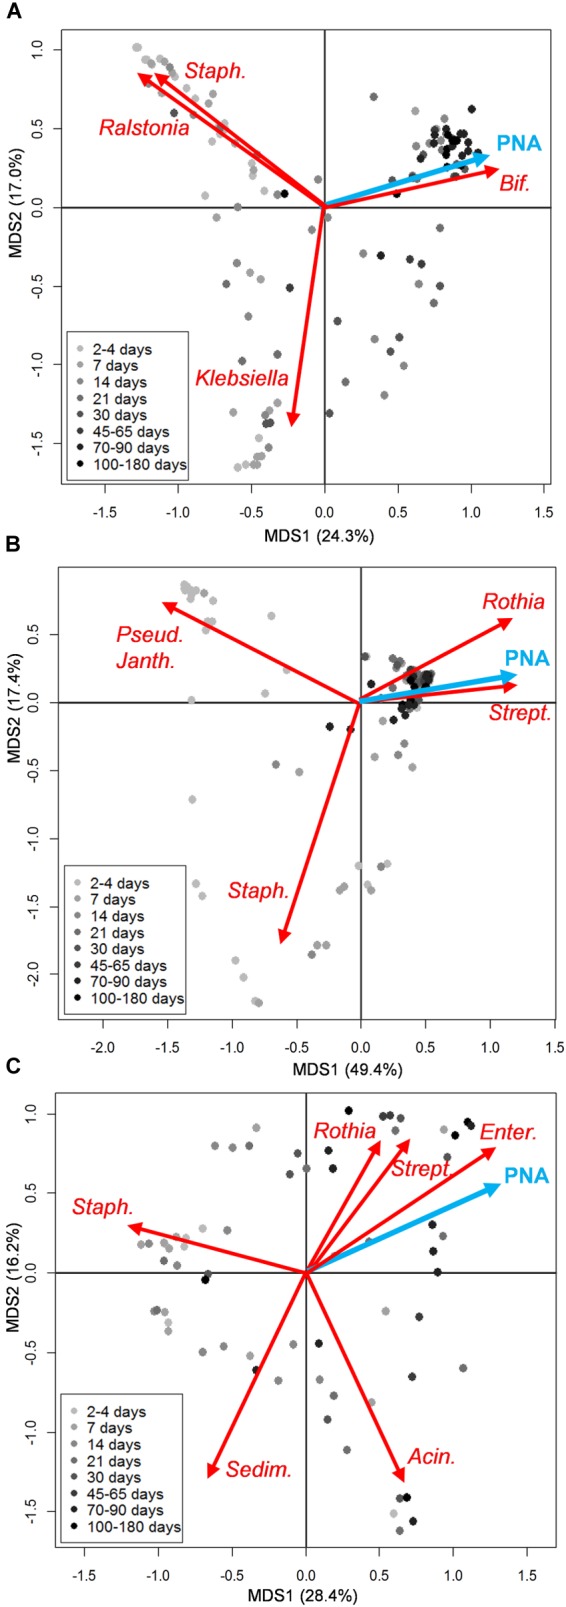
FIGURE 1.

Microbiota structure of the infant’s gut and mouth and mother’s milk in moderately preterm infants, in relation to postnatal age. Principal Coordinates Analyses (PCoA) based on Bray-Curtis distances between genus-level relative abundance profiles of fecal (A), oral (B), and mother’s milk (C) samples. Samples are depicted as dots filled in with different shades of gray, from light (earlier samples) to dark (later samples), according to the sampling time (days from birth). A legend for the gray scale is provided. First and second coordination axes are reported in each plot; percentages of variation in the datasets explained by each axis are reported. Postnatal age (PNA, expressed in days from birth at which each sample was taken) as a quantitative environmental variable is depicted as a blue arrow. The biplot of the average bacterial coordinates weighted by the corresponding bacterial relative abundance per sample was superimposed on the PCoA plot for abundant (average relative abundance > 1%) bacterial genera that most significantly contributed to the ordination space (envfit, P < 0.001) (red arrows). Some of the genus names are abbreviated as follows: Staph., Staphylococcus; Bif., Bifidobacterium; Pseud., Pseudomonas; Janth., Janthinobacterium; Strept., Streptococcus; Enter., Enterococcus; Sedim., Sediminibacterium; Acin., Acinetobacter. See Supplementary Figures S1–S3 for details about sampling times for each infant.
