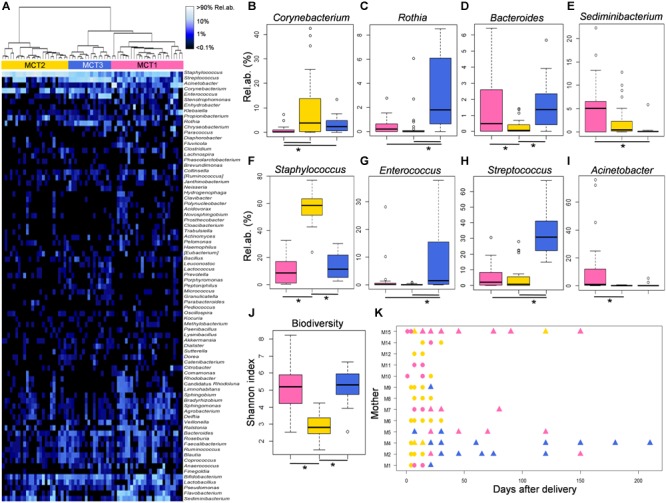
FIGURE 3.

Features of the three Milk Community Types (MCTs). (A) MCTs were defined by Ward clustering on Euclidean distances calculated between the genus-level milk microbiota profiles. Samples assigned to MCT1, MCT2, and MCT3 are depicted in pink, gold and blue, respectively. (B–I) Relative abundances of bacterial genera for which a significant difference among MCTs was found (Kruskal-Wallis test, FDR corrected P < 0.05) are shown as boxplots. (J) Levels of alpha diversity calculated as Shannon index are depicted as boxplots for each MCT. Lines and stars below each plot indicate significant differences for pairwise comparisons (post-hoc Tukey and Kramer test). (K) Dynamics of the milk microbiome through each MCT for each enrolled lactating mother. Symbols represent sampling times for each subject. Triangles indicate samples taken after latching and start of actual breastfeeding.
