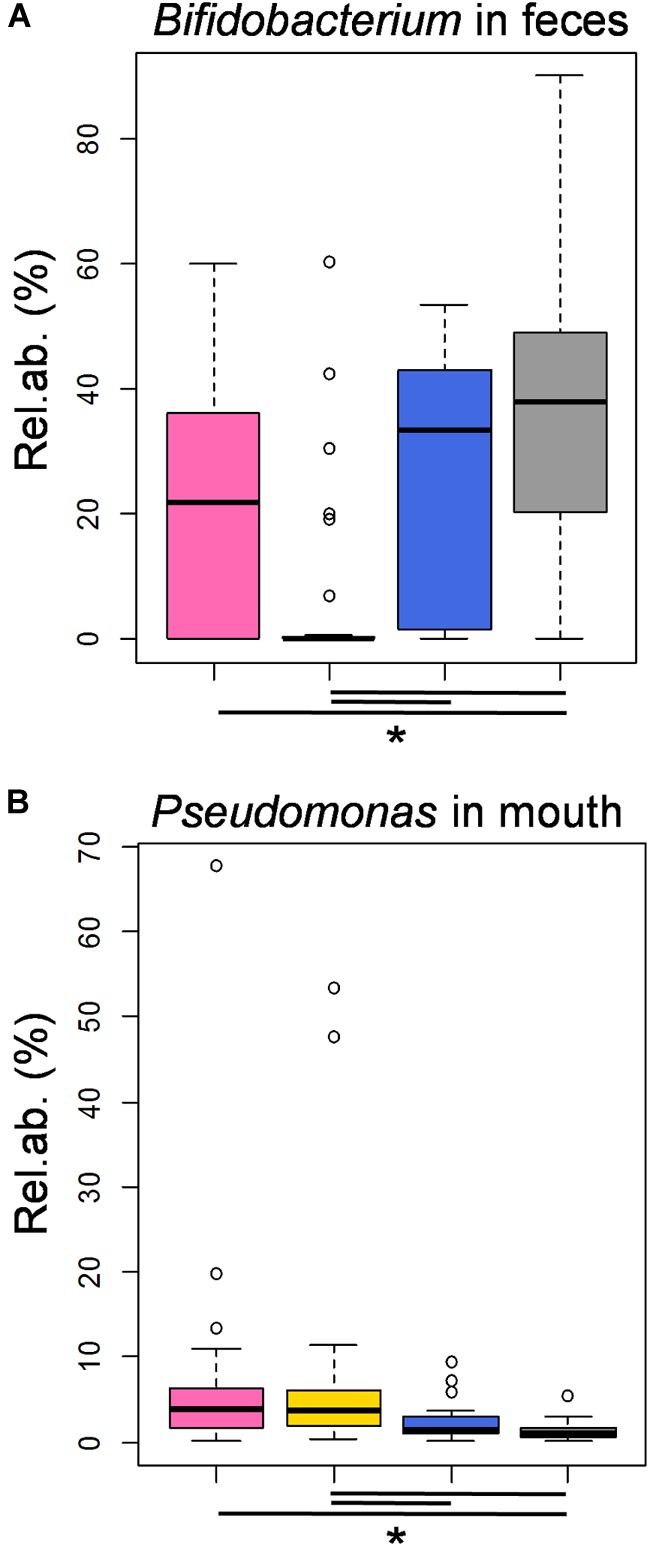
FIGURE 4.

Features of the moderately preterm infants’ fecal and oral bacterial ecosystems associated with the three MCTs, in comparison to healthy, exclusively breastfed, full term infants. Boxplots of the relative abundances of OTUs assigned to the genera Bifidobacterium and Pseudomonas in fecal (A) and oral (B) samples, respectively, taken from the enrolled moderately preterm infants at time points in which the corresponding milk samples harbored a MCT1 (pink), MCT2 (gold) or MCT3 (blue). In gray, the data obtained in samples taken from healthy, full term, actively and exclusively breastfed 21-day-old infants (Biagi et al., 2017; sequence reads re-analyzed together with those obtained in the present study). Lines and stars below each plot indicate significant differences for pairwise comparisons (post-hoc Tukey and Kramer test, after Kruskal-Wallis test, P < 0.05).
