Figure 5.
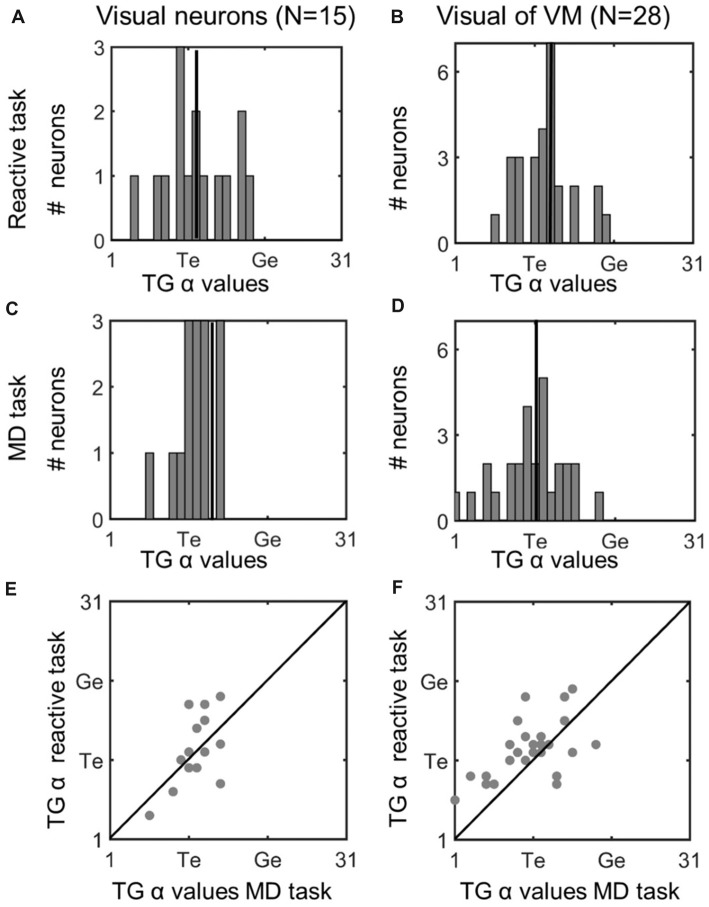
Comparison of TG continuum coding of reactive vs. memory delay task in visual responses. Left column (A,C,E): visual neurons; right column (B,D,F): visual response of VM neurons. Top row (A,B): TG value distributions in the reactive task. Vertical line indicates the median. Second row (C,D): distributions for same neurons in the memory delay (MD) task. Visual neurons showed a more restricted distribution, but there was no significant difference between the TG values between the two tasks. Bottom row (E,F): illustrates neuron-by-neuron comparison between the two tasks in the visual activity of Visual and VM neurons, respectively, plotting the TG continuum values from the reactive task as a function of the MD task.

