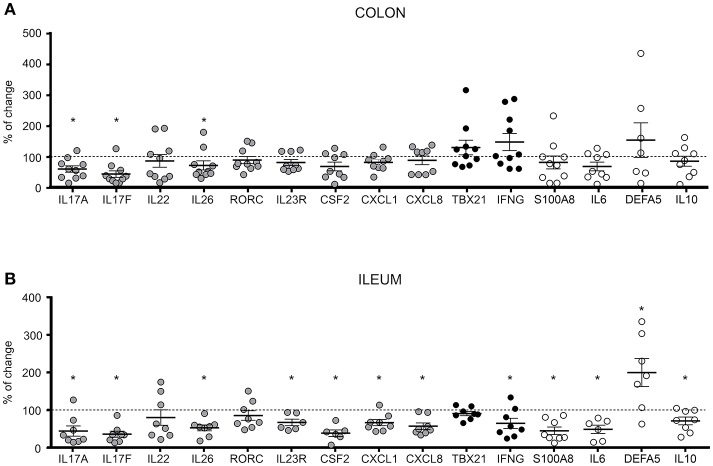
Figure 3.
Differential expression of Th17, Th1 and CD-related genes in BI119- treated intestinal biopsies from active CD patients. Messenger RNA levels of untreated (A) colonic (n = 8–10) and (B) ileal (n = 6–8) biopsies were set as the 100% value for each donor (dashed line), and expression of BI119–treated samples was shown as the percentage thereof. Gray: Th17-related genes. Black: Th1-related genes. Mean ± SEM. ns > 0.05, *P ≤ 0.05.

