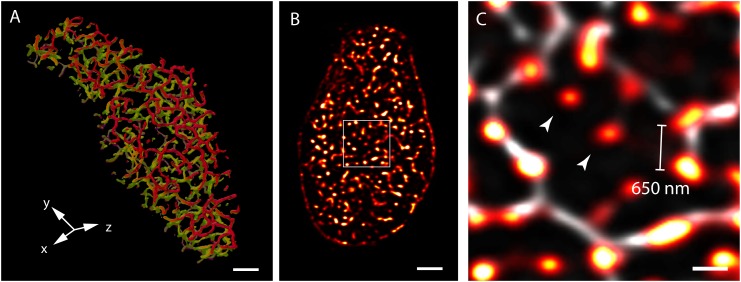
FIGURE 1.
View of the t-system and couplons of rat ventricular myocytes. (A) An isosurface reconstruction of the t-tubular network in a myocyte imaged with confocal microscopy in transverse orientation. The regions coloured in red and green respectively are tubules at two adjacent Z-discs; tubules extending between the Z-discs are coloured in purple. (B) A transverse view of punctate RyR staining in a myocyte visualised with high resolution confocal imaging; (C) Magnified view of the RyR clusters (red hot) of the region demarcated in (B), overlaid with the corresponding t-tubule staining (grey). The typical distance between neighbouring clusters detected with this method was ∼650 nm. Examples of ‘non-junctional’ clusters which did not align with the t-tubules are noted with arrowheads. Scale bars, (A,B): 2 μm, (C): 500 nm. All data re-rendered from Jayasinghe et al. (2009).

