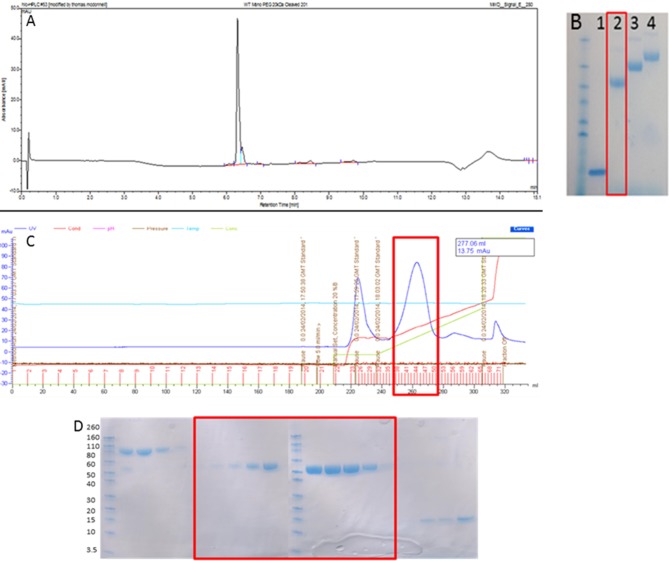
Figure 1.
Production of monoPEGylated DI. (A) A chromatogram demonstrating the production of >95% pure conjugated WT-PEG-DI shown as a single peak by Reverse Phase HPLC using a C18 column. (B) SDS PAGE gel showing unmodified WT-DI (lane 1), WT-DI conjugated to 20 kDa PEG (lane 2), WT-DI conjugated to 30 kDa PEG (lane 3), and WT-DI conjugated to 40 kDa PEG (lane 4). The red box around lane 2 indicates the sample shown in chromatogram (A). (C) Chromatogram showing the result of cation exchange purification to separate non-conjugated WT-DI from PEG-WT-DI. The peak at 225 ml is diPEGylated WT-DI. The large peak at 260 ml, highlighted by the red box, is monoPEGylated WT-DI. The small peak at 320 ml is residual non-PEGylated WT-DI. (D) SDS PAGE gel showing the different forms of WT-PEG-DI obtained from the cation exchange purification (C). The Bands in the three lanes at the far left are diPEGylated WT-DI. Bands in the center, highlighted by the red box, are monoPEGylated WT-DI. The faint bands in the lanes on the far right are residual non-PEGylated WT-DI.

