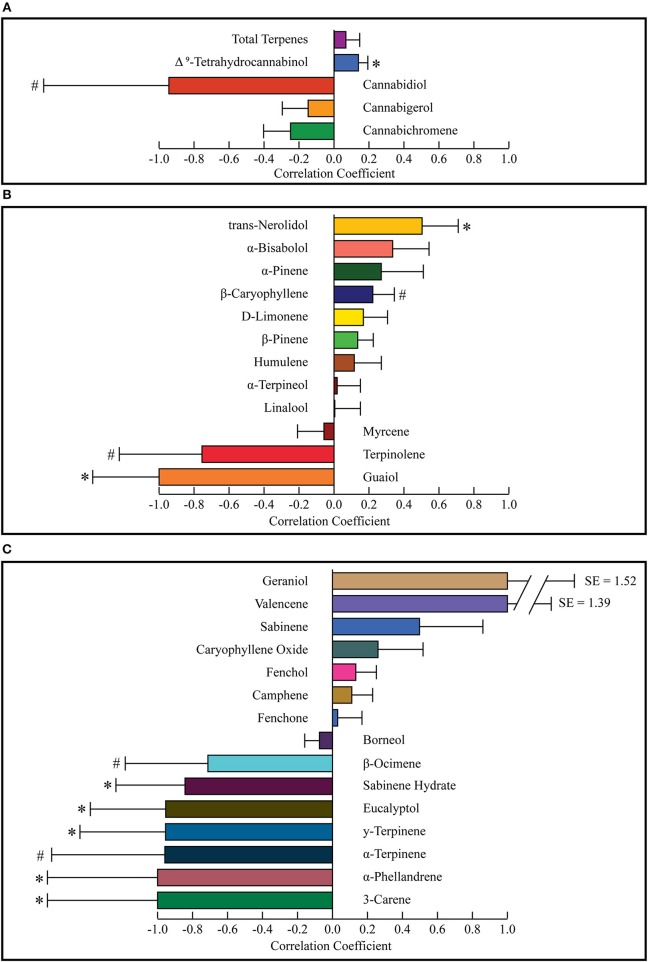
Figure 4.
Correlation coefficients for cannabinoids and total terpenes (A) major terpenes (B), and minor terpenes (C). Correlation coefficients were calculated for each constituent using a difference of means test. The weighted average of the least effective was subtracted from the most effective and divided by their sum to calculate the correlation coefficient. Weighted standard distributions were used to calculate p-values with a two-sided t-test. Values market with * indicate p < 0.05 and those marked with # indicate 0.05 < p < 0.10. SE, Standard Error.

