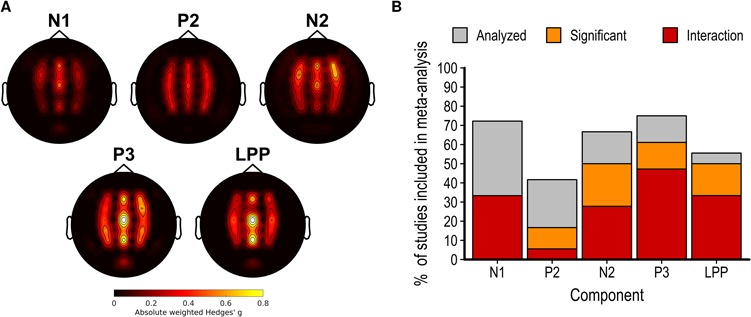
Fig. 6.

(A) Scalp map of the average partial eta squared weighted by the number of studies reporting results at this electrode for the main effect of pain observation on each electrode and component. (B) Bar graph showing the proportion of studies included in the meta-analysis analysing each component, reporting a significant main effect of pain and a significant interaction between this effect and another factor.
