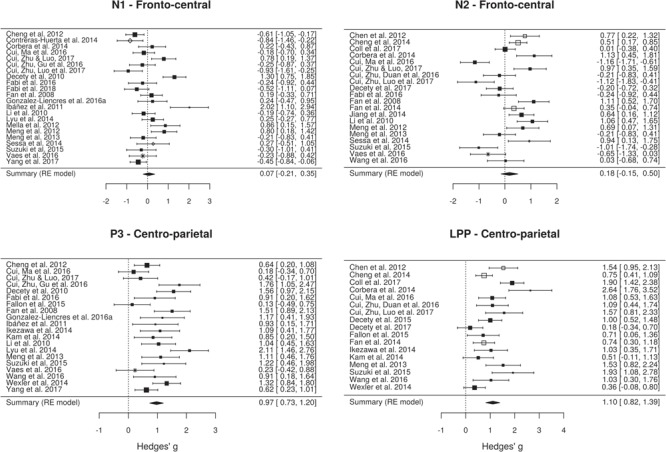
Fig. 7.

Forest plots showing the effect size and 90% CI for the effect of pain observation on the ERP amplitude at the frontal electrodes from the N1, N2, P3 and LPP components. Positive effects indicate higher (more positive) amplitudes for pain pictures and negative effects indicate lower (more negative) amplitudes for the pain pictures. Symbols show the type of stimulus used in each study (black square, static limbs; white square, dynamic limbs; white diamond, static faces; asterisk, other). Symbol size shows the relative sample size for this component/location.
