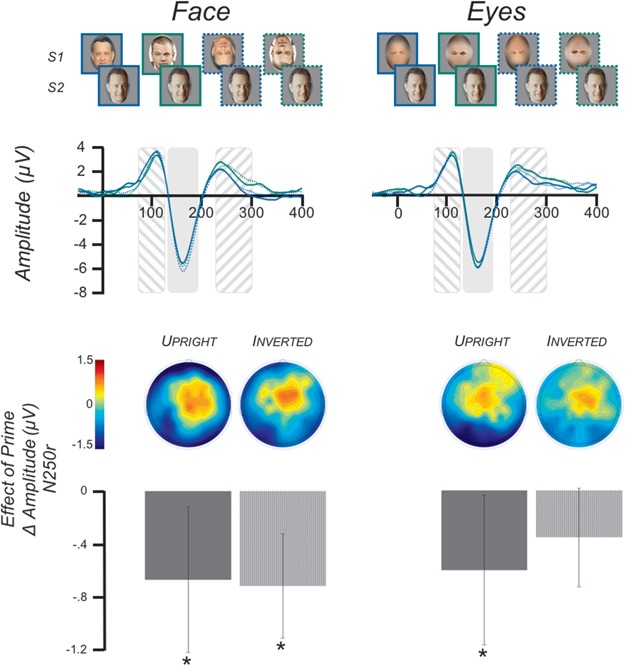
Fig. 2.

Study 2 Stimuli and ERP results. (FIRST ROW) The eight trial types used in Study 2 were two levels of prime (none, different) × two levels of feature (face, eyes) × two levels of orientation (upright, inverted). (SECOND ROW) Grand-average ERPs (N = 27) across electrodes P8, P10, TP8, P7, P9, TP7. The time period of the P100 is indicated by the area with downward slashes. NOTE: this figure displays the waveform across the electrodes listed above, whereas the P100 statistics were done on the average waveform of electrodes C1, Cz, C2. The time period of the N170 is indicated by the solid shaded area. The time period of the N250r is indicated by the area with upward slashes. The waveforms are color coded such that SOLID BLUE is the primedifforientationup condition, SOLID GREEN is the primenoneorientationup condition, DASHED BLUE is the primedifforientationinv condition and DASHED GREEN is the primenoneorientationinv condition. (THIRD ROW) Topographical maps of the N250r priming effect. The maps display the primediffvs primenone simple contrast for each cell of the feature and orientation factors. (FOURTH ROW) N250r mean amplitude differences across electrodes P8, P10, TP8, P7, P9, TP7. The contrasts displayed are the same as for the topographical maps. Error bars indicate the 95% confidence interval. Asterisks indicate significant priming effects, P < 0.05.
