
Figure 2.
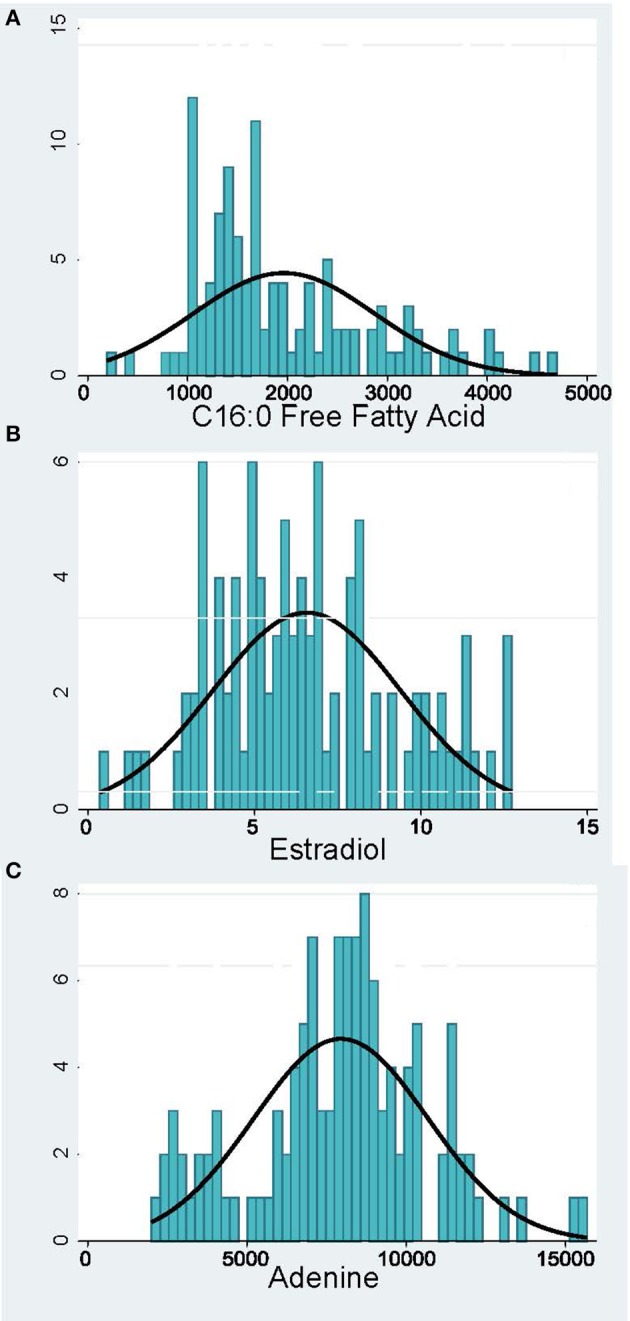
Distribution of representative metabolomic markers: (A) Inflammation and Lipid Biosynthesis, (B) Hormones, (C) Nucleotide Metabolism. The x-axis shows the relative abundance of the metabolite and the y-axis—the number of pregnant women.
Official websites use .gov
A
.gov website belongs to an official
government organization in the United States.
Secure .gov websites use HTTPS
A lock (
) or https:// means you've safely
connected to the .gov website. Share sensitive
information only on official, secure websites.
Distribution of representative metabolomic markers: (A) Inflammation and Lipid Biosynthesis, (B) Hormones, (C) Nucleotide Metabolism. The x-axis shows the relative abundance of the metabolite and the y-axis—the number of pregnant women.