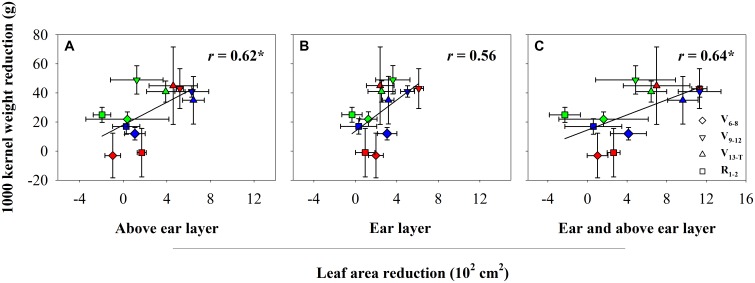
FIGURE 1.
The relationship between kernel weight and leaf area reduction at above ear layer (A), ear layer (B), and ear and above ear layer (C) in 2014 (red), 2015 (blue), and 2016 (green). CK, well-irrigated treatment; V6−8, water deficit during the 6–8-leaf stage; V9−12, water deficit during the 9–12-leaf stage; V13−T, water deficit from the 13-leaf stage to tasseling stage, R1−2, water deficit from the silking stage to blister stage. ∗indicates significance at P < 0.05.

