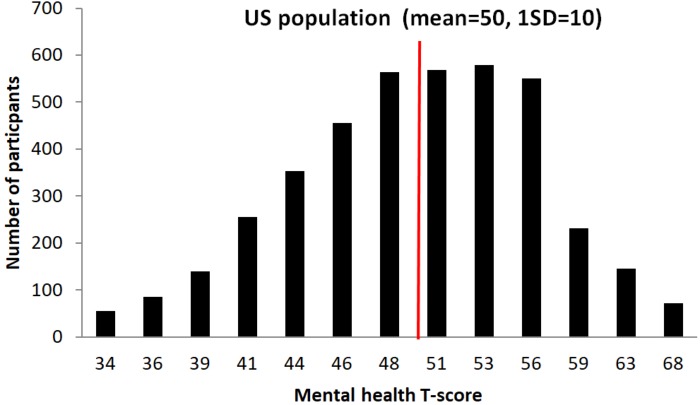
FIGURE 5.
Graphical representation of participant’s T-scores distribution in the Mental Health sub-questionnaire, and comparison with US population. An independent samples t-test showed that the scores in the Mental Health index of all BBHI participants (N = 4206; mean = 49.8; SD = 6.9) do not differ significantly from reference scores of the general US population (values taken from PROMIS Global health scoring Manual: mean = 50; SD = 10; t = 1.7, p = 0.10).

