
Figure 7.
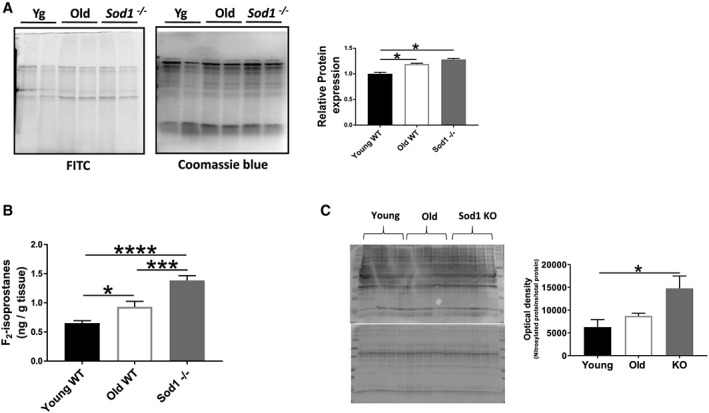
Markers of oxidative stress. (A) Protein carbonylation detected using avidin‐fluorescein isothiocyanate (FITC) affinity staining in gastrocnemius muscle; (B) F2‐isoprostane levels in quadriceps muscle; and (C) western blot analysis of the nitrated proteins from the gastrocnemius muscles of young and old wild‐type (WT) and Sod1 −/− mice. Values are expressed as mean ± SEM (n = 8–12 per group); one‐way analysis of variance. * P ≤ 0.05, *** P ≤ 0.001, **** P ≤ 0.0001.