
Figure 3.
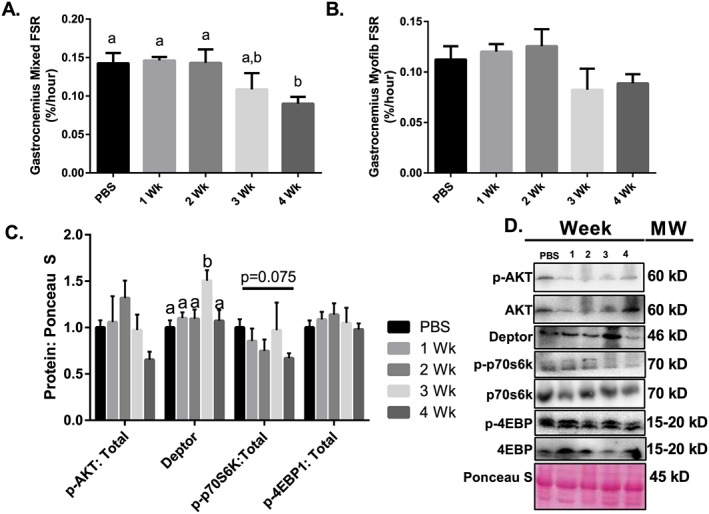
Protein synthesis throughout the progression of cancer cachexia. (A) Mixed FSR throughout the progression of cancer cachexia. (B) Myofibrilar FSR throughout the progression of cancer cachexia. (C) AKT phosphorylation relative to total protein content. Deptor protein content throughout the progression or cancer cachexia. 4EBP1 phosphorylation relative to total protein content. p70s6k phosphorylation relative to total protein content. (D) Sample images for immunoblot analysis. N of 7–8 was utilized for each group. Lettering denotes statistical significance (means that do not share the same letter are statistically different) at an alpha set at P < 0.05.