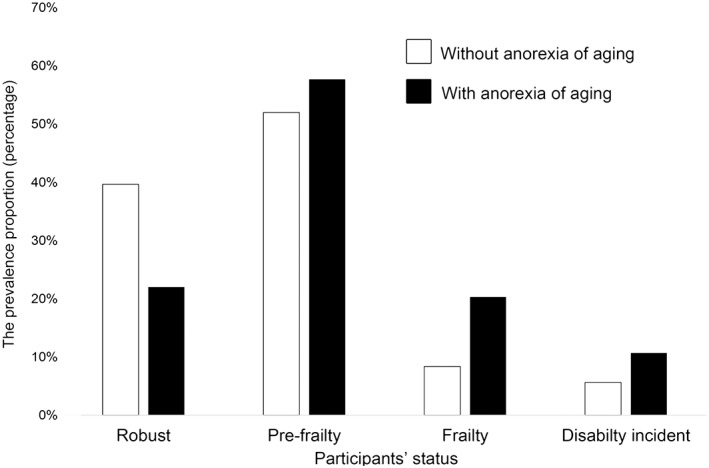
Figure 1.

Prevalence of frailty and prevalence proportion of disability between older adults with/without anorexia of ageing. Bar graphs indicate the percentage of older adults with each frailty status (robust, pre‐frailty, or frailty) and the percentage of incident disability between those with/without anorexia of ageing.
