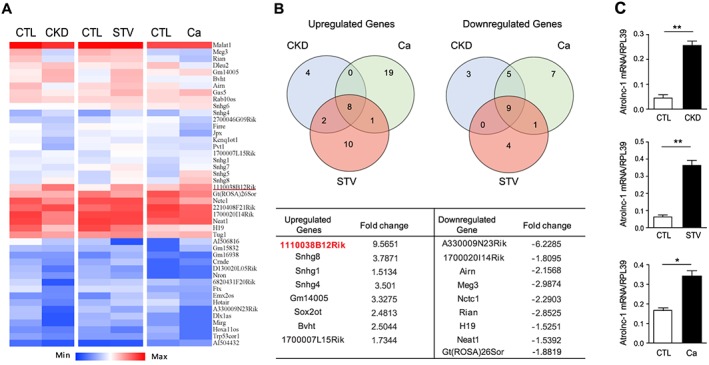
Figure 1.

Atrolnc‐1 (1110038B12Rik) is significantly up‐regulated in muscles of different catabolic conditions. (A) Heat map of lncRNA PCR Array shows differentially expressed lncRNAs in quadriceps muscles of chronic kidney disease (CKD), Starvation (STV), and cancer (Ca) models. (B) The Venn diagrams demonstrate the overlap among upregulated (left) and downregulated (right) lncRNAs in CKD (blue circle), STV (red circle), and Ca (green circle) models. The name and fold change of the specific lncRNAs in the overlap regions are summarized in the table. (C) qRT‐PCR confirmed the upregulation of Atrolnc‐1 in different muscle wasting models. Data are shown as means ± SEM, n = 5 mice per group, *P < 0.05, **P < 0.01.
