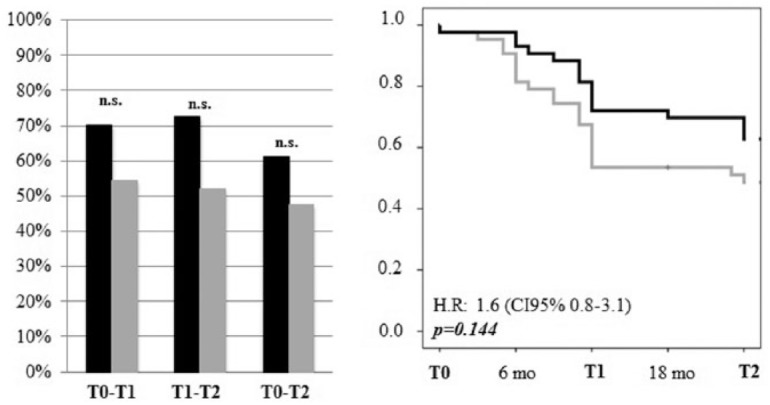
Figure 3.

NEDA-3. Left panel: Percentage of patients treated with natalizumab (black bars) or fingolimod (grey bars) that achieved NEDA-3 status at each timespan (T0–T1, T1–T2, T0–T2). Right panel: Survival curves demonstrating the proportion of patients that achieved the NEDA-3 status (natalizumab: black line, fingolimod: grey line).
NEDA, no evidence of disease activity.
