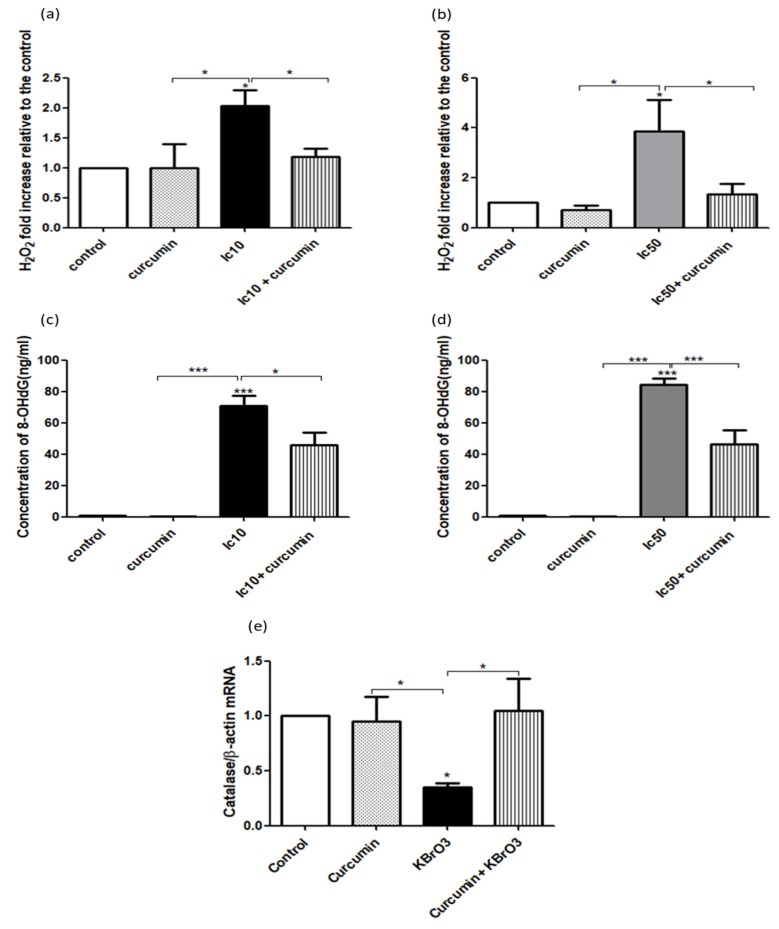
Fig. (2).
Analysis of curcumin protection on RPTEC/TERT1 against KBrO3 induced oxidative stress and DNA adduct formation.
Fig. (2a, b) Cells were seeded in 24 well plates until fully confluent. After 10 days, cells were treated with 0.1% DMSO (control), curcumin, KBrO3 and a combination of KBrO3 + curcumin. Intracellular concentration of H2O2 was detected using the Amplex Red Hydrogen Peroxide Assay Kit. The data represents three independent experiments, *= p< 0.05.
Fig. (2c, d) DNA adduct formation was investigated by measuring the intracellular concentration of the DNA adduct 8-OHdG, using the Highly Sensitive 8-OHdG Check ELISA kit following the manufacturer kit instructions. The data represents three independent experiments. *= p< 0.05, **= p<0.01, and ***=p <0.001.
Fig. (2e) Catalase gene expression was examined in KBrO3 (5.5mM) treated RPTEC/TERT1 cells after 24h treatment by RT-PCR analysis (* = P < 0.05).

