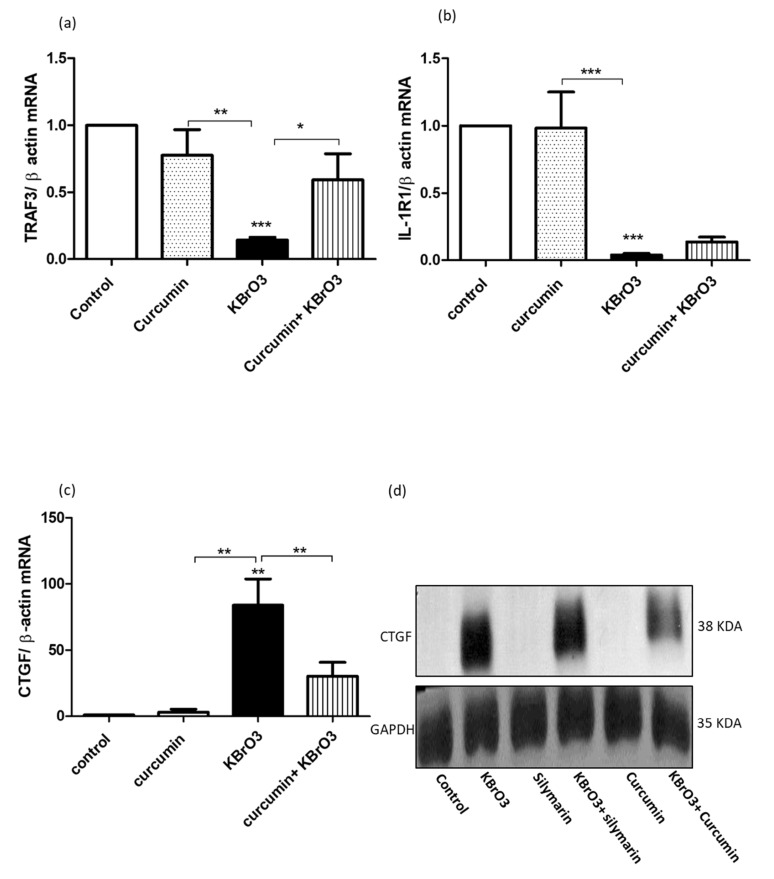
Fig. (3).
Analysis of the effects of KBrO3 on TRAF3, IL-1R1, and CTGF gene expression, and the protective potential of curcumin.
Fig. (3a, b) KBrO3 (5.5mM) treatment of RPTEC/TERT1 for 24h onTRAF3 and IL-1 gene expression, respectively compared with the untreated or curcumin-treated cells. Tthe data represents three independent experiments. (*= P> 0.05).
Fig. (3c, d) KBrO3 (5.5mM)- treatment of RPTEC/TERT1 for 24h on CTGF at both mRNA and protein levels in comparison the untreated or curcumin-treated cells. The data represents three independent experiments (**=P < 0.01).

