
FIG 1.
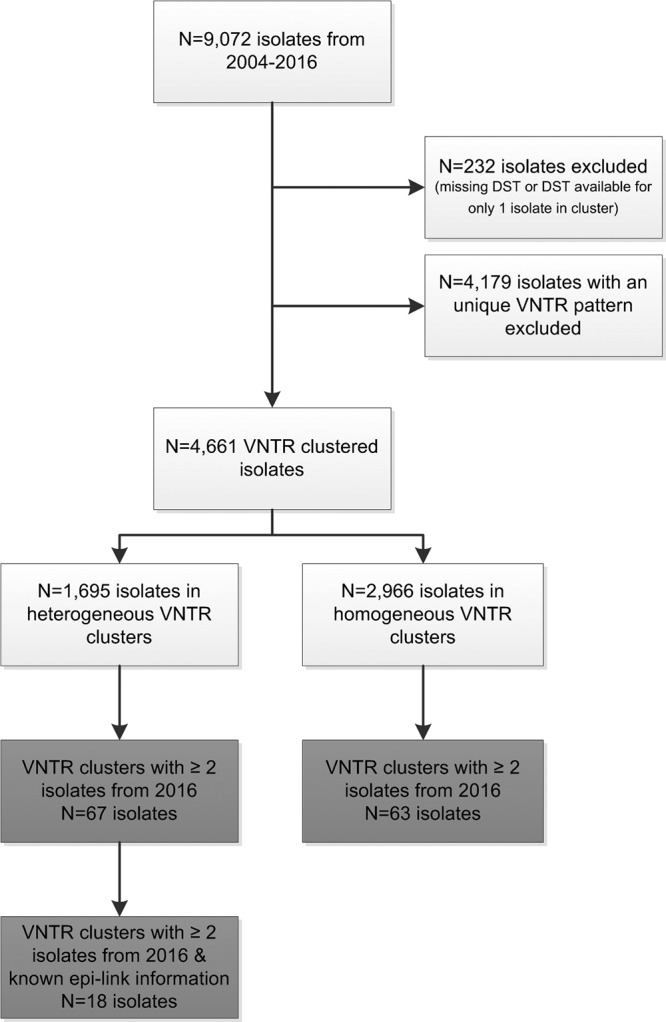
Flowchart of the inclusion and exclusion of isolates from January 2004 to December 2016 for VNTR and WGS analyses. Light gray, inclusion of isolates for VNTR typing; dark gray, inclusion of isolates for WGS.
Official websites use .gov
A
.gov website belongs to an official
government organization in the United States.
Secure .gov websites use HTTPS
A lock (
) or https:// means you've safely
connected to the .gov website. Share sensitive
information only on official, secure websites.
Flowchart of the inclusion and exclusion of isolates from January 2004 to December 2016 for VNTR and WGS analyses. Light gray, inclusion of isolates for VNTR typing; dark gray, inclusion of isolates for WGS.