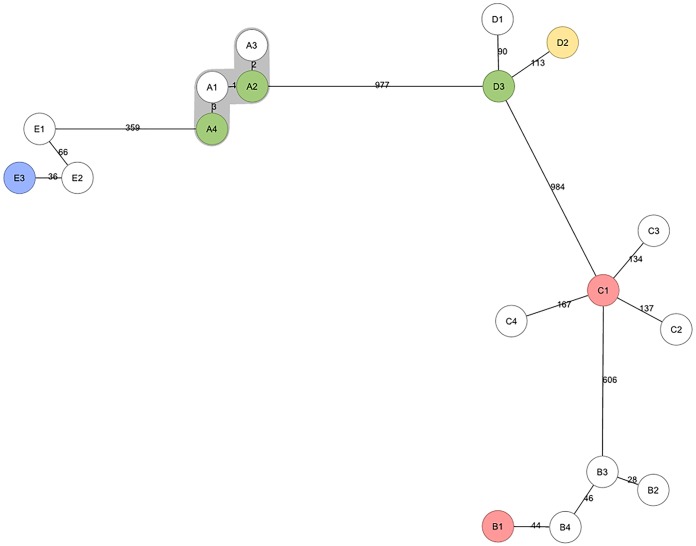
FIG 3.
Minimum spanning tree of five heterogeneous VNTR clusters (clusters A to E) analyzed by WGS. Clustering by WGS is represented in gray, and the genetic distances in SNPs to the nearest isolate are shown on the branches. White, susceptible samples; green, streptomycin-resistant samples; red, isoniazid-resistant samples; blue, isoniazid- and streptomycin-resistant samples; yellow, rifampin-, isoniazid-, ethambutol-, and streptomycin-resistant samples.

