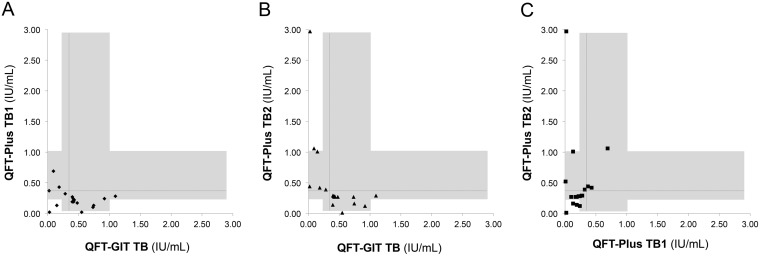
FIG 1.
Discordant results in 20 cases. The figure shows quantitative results for QFT-GIT TB versus QFT-Plus TB1 (A), QFT-GIT TB versus QFT-Plus TB2 (B), and QFT-Plus TB1 versus QFT-Plus TB2 (C) for the 20 cases with discordant results. The horizontal and vertical dashed lines indicate the cutoff value (0.35 IU/ml), and the shaded areas indicate the range of 0.3 to 1.0 IU/ml.

