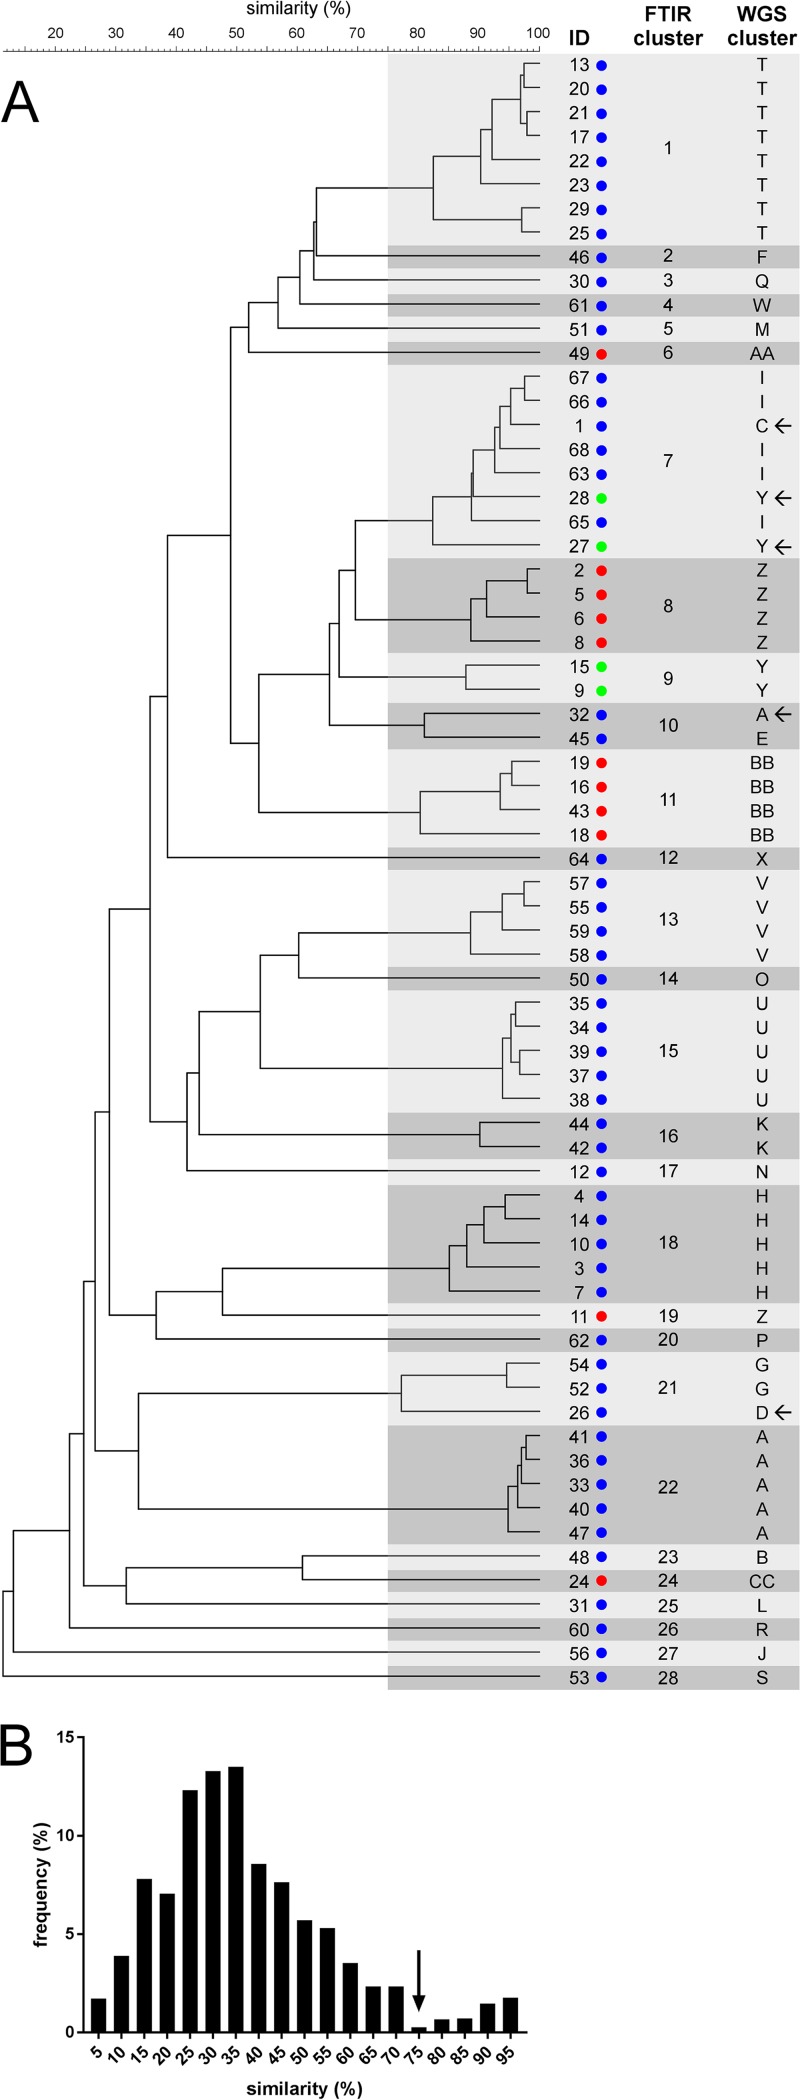
FIG 2.
Clustering of FTIR spectra of 68 Klebsiella isolates. (A) The dendrogram was calculated by UPGMA clustering of the pairwise Euclidean distances of the isolate spectra. Clusters are displayed as shaded boxes. The species of each isolate is indicated by a colored circle (blue, K. pneumoniae; red, K. variicola; green, K. quasipneumoniae), and the corresponding WGS cluster of the isolate is derived from Fig. 1. Incongruently clustered isolates are marked with arrows. (B) Frequency distribution of all pairwise FTIR spectrum similarities. The similarity value with the lowest frequency (arrow) between the peaks of the bimodal distribution was used as the cluster cutoff in panel A.

