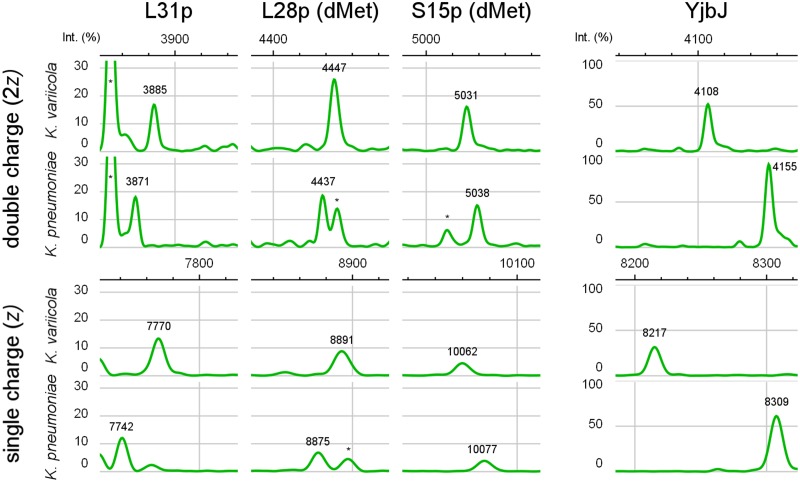
FIG 4.
Species-specific MALDI-TOF mass peaks. Shown are MALDI-TOF spectrum peaks for K. pneumoniae (ID 32) and K. variicola (ID 49) that represent the singly (z) or doubly (2z) charged ions of three ribosomal proteins (unmodified or with the leading methionine removed [dMet]) and one stress response protein. The m/z ratios of the peaks are given. The height of each peak reflects the relative intensity (Int.) with respect to the highest peak in the spectrum. Neighboring peaks without relevance for the species delineation are marked by asterisks.

