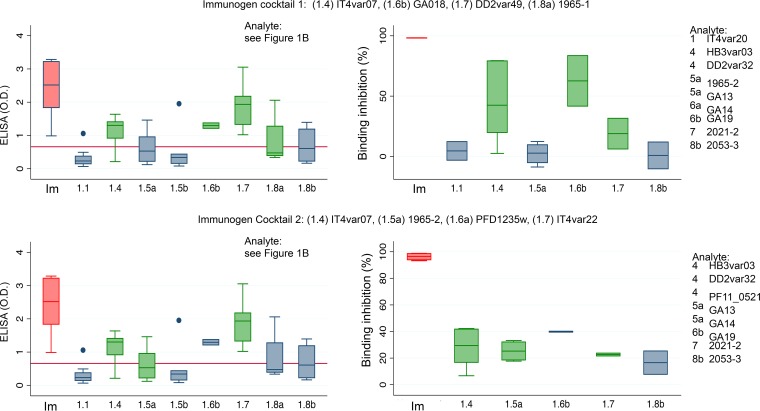
FIG 4.
Antibody reactivity and EPCR binding inhibition of IgG from animals immunized with cocktails of four different CIDRα1 domains as indicated. IgG reactivity to 31 different CIDRα1 domains (analytes marked E” in Fig. 1B) was measured by ELISA (as optical density [OD]). Analytes used for testing EPCR binding inhibition are listed with subtypes and specific sequence variants. Data are shown grouped by the domain used for immunization (Im) and by the CIDRα1 subtype of the analyte, e.g., CIDRα1.1 (1.1). Data for immunogens are shown in red; data for which the immunogen and analyte CIDRα1 are overlapping or not overlapping are shown in green or blue, respectively. Box plots show median reactivity with 25th and 75th percentiles and upper and lower adjacent values. For these assays His-tagged CIDRα1 domains were used both for immunization and for the ELISAs, and plasma was depleted for His-IgG prior to ELISAs. Red lines on the left panels indicate the levels of residual anti-His-IgG in the plasma.

