FIG 3.

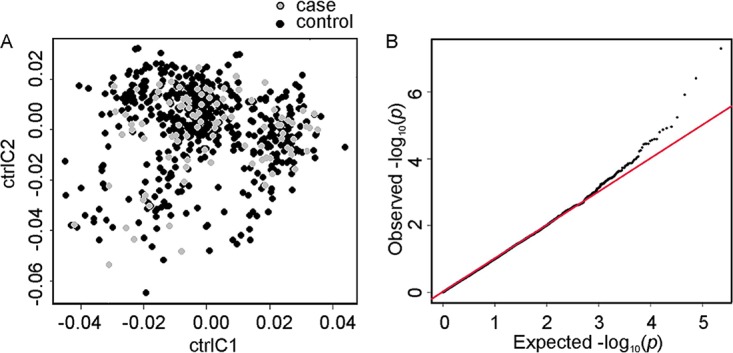
Statistical analysis. (A) Multidimensional scaling plot based on the first two components, C1 and C2, of identity by state values, indicating that the case and control groups are ethnically matched. (B) Quantile-quantile plot of observed versus expected distribution of association P values.
