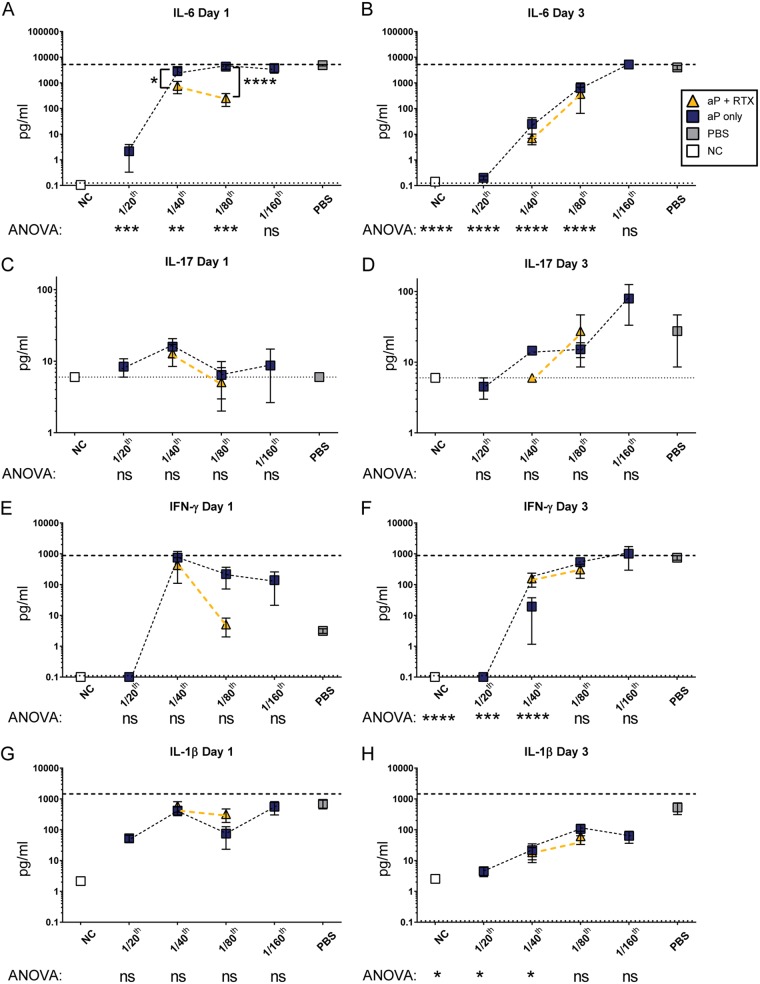
FIG 4.
Analysis of proinflammatory cytokines from lungs of mice immunized with aP titrations or aPs supplemented with RTX. (A to H) Th1-associated cytokines from supernatant of lung homogenates analyzed at days 1 and 3 postchallenge. Cytokines IL-6 (A and B), IL-17 (C and D), IFN-γ (E and F), and IL-1β (G and H) are shown. The blue boxes indicate aP groups, whereas aP-plus-RTX groups are indicated by gold triangles. Gray squares indicate mock-vaccinated and -challenged mice, while white squares represent nonvaccinated and nonchallenged mice (NC). Results are means ± SEM. ****, P < 0.0001; ***, P < 0.001; **, P < 0.01; *, P < 0.05. P values were determined by one-way ANOVA with Tukey's post hoc test compared to the PBS (naive) group of challenged mice. Brackets between two points represent unpaired two-way t test. A dashed line indicates the upper limit of detection, and a dotted line indicates the lower limit of detection.

