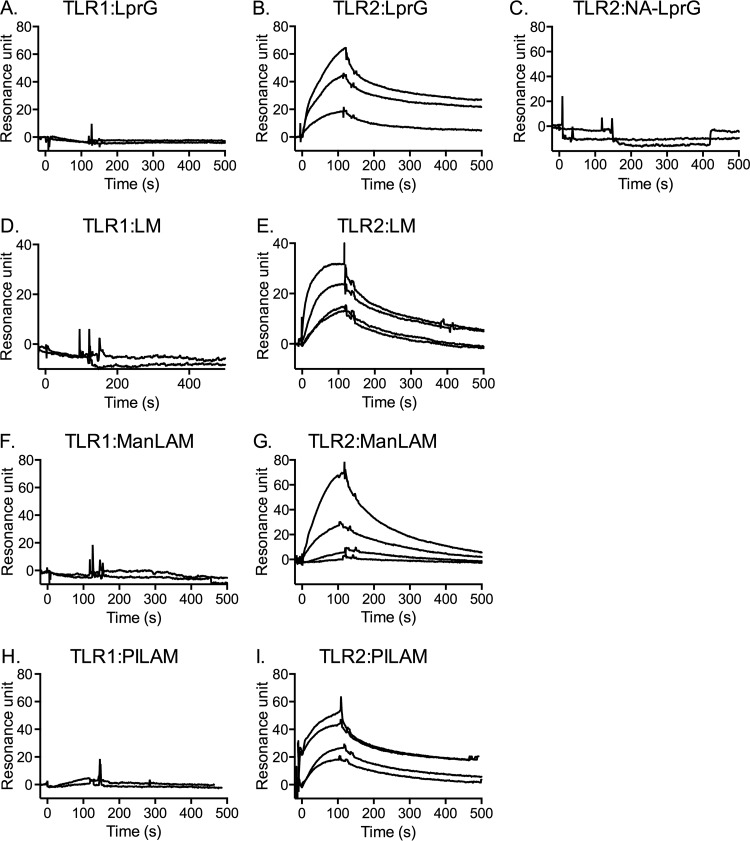
FIG 1.
LprG and mycobacterial lipoglycans bind to TLR2 in the absence of TLR1, but not to TLR1 in the absence of TLR2. Binding was evaluated by SPR and measured as resonance units. TLR1 (A, D, F, and H) or TLR2 (B, C, E, G, and I) was immobilized on a CM5 sensor chip. Sensorgrams were obtained by injecting LprG (A and B) or NA-LprG (C) at 625 nM, 2,500 nM, or 5,000 nM or by injecting LM (D and E), ManLAM (F and G), or PILAM (H and I) at 100 nM, 200 nM, 312 nM, or 625 nM. In each graph, the top curve corresponds to the top analyte concentration, and each successive curve below is the next lower analyte concentration. (A, D, F, and H) Only the curves for the two highest concentrations are shown (the other concentrations also revealed no detectable binding). Binding curves were calculated with BIA evaluation 3.1 software with subtraction of nonspecific binding of the analyte to matched sensor chip control cells without immobilized TLR2 or TLR1. The results are representative of three independent experiments.

