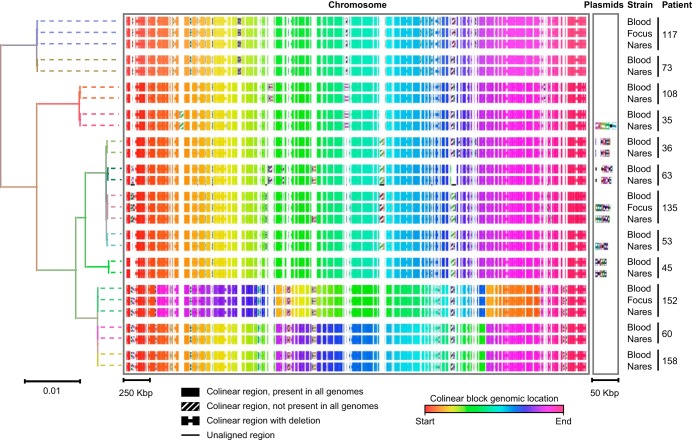
FIG 1.
Genomic comparison of study strains with block alignments. Shown is a maximum likelihood phylogenetic tree based on core genome SNVs of all patient clones (left), with a graphical representation of the complete genome alignment (right). Branches in the phylogenetic tree are colored according to the patient from whom each strain originated. Bars indicating the number of substitutions per site in the phylogenetic tree or the alignment block length are shown at the bottom. Dotted lines are included in the tree as guides and do not reflect genetic distance. Core colinear blocks present in all isolate genomes are shown as solid rectangles in the multiple alignment and are colored according to the block location in each genome to highlight inversions (key at the bottom). Noncore regions present in only a subset of genomes are each represented with a unique striped fill pattern.

