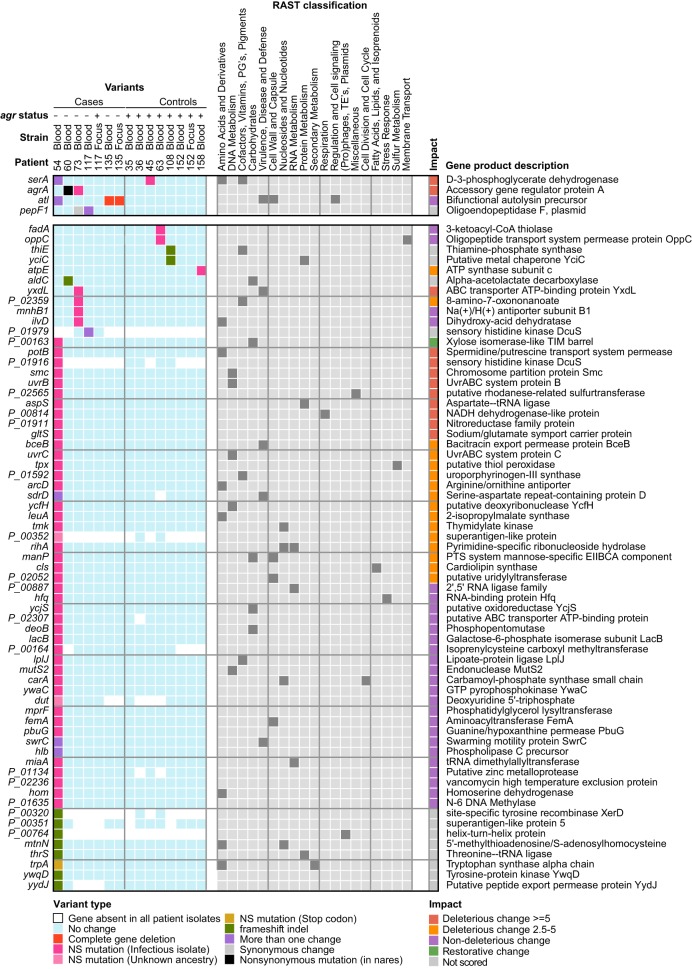
FIG 2.
Map of SNVs and indels found in infecting strains. Shown is a mutation matrix of genes (rows) affected by variants of <5 nt that are unique to infecting strains (columns) or for which an ancestral state could not be determined. Genes mutated in multiple patients are grouped at the top, and the color key for different mutation types is shown at the bottom. RAST subsystem classifications associated with each gene are shown in the center (gray). PROVEAN scores (90) were calculated for each nonsynonymous mutation to assess the impact of a variant on the biological function of the encoded protein and are displayed in the rightmost column, with the key shown below. In cases where multiple variants were found in a gene, the PROVEAN score with the highest absolute value for each gene is shown. PG's prosthetic groups; TE's, transposable elements; PTS, phosphotransferase system.

