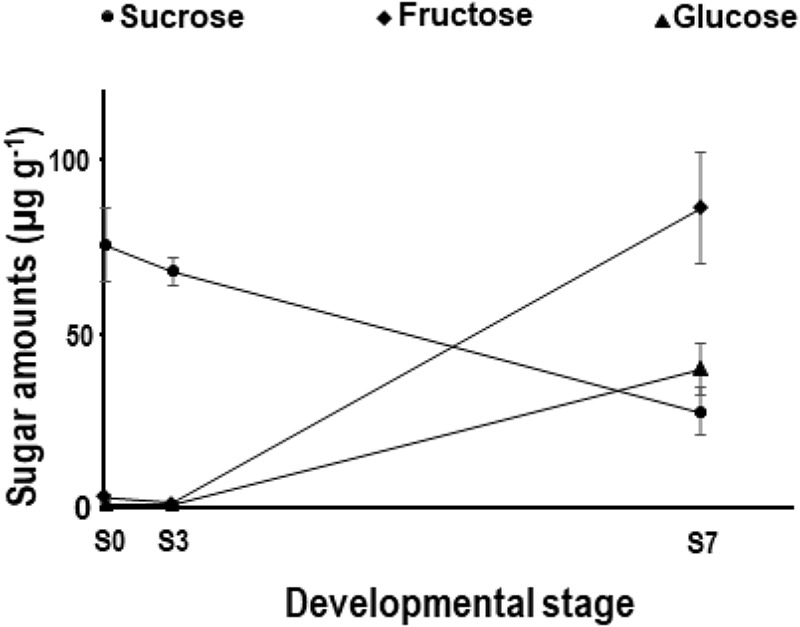
FIGURE 2.

Sugar content in germinating Q. ilex seeds. Sucrose, glucose, and fructose content in the embryo axis at the S0, S3, and S7 stages were determined by GC-MS. Data are means ± SE of measurements made on 20–50 seeds per sampling time, grouped in three pools. Changes between the S3 and S7 stages were statistically significantly different at the P < 0.001 value (Student’s t-test).
