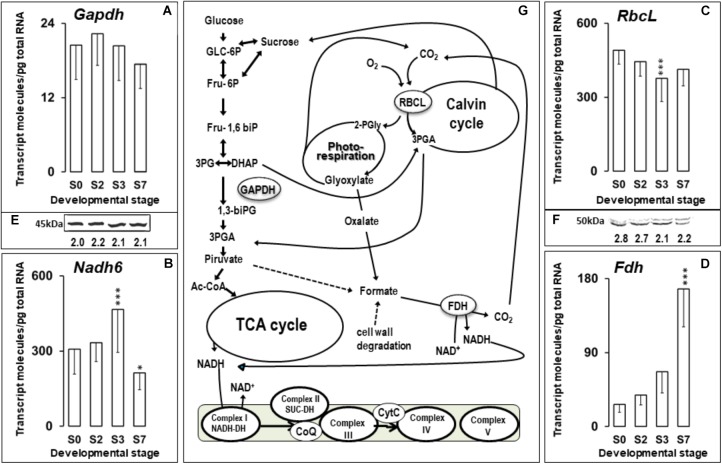
FIGURE 6.
(A–D) Absolute quantitation of Gapdh, Nadh6, RbcL, and Fdh transcript molecules in embryo axis tissue isolated from non-imbibed seed (S0) or after 10 h (S2), 24 h (S3), and 216 h (S7) of germination. Transcript data are the means ± SD of transcript molecules/pg of total RNA from three biological replicates made in quadruplicate. Each biological replicate was a pool generated by mixing equal amounts of homogenized tissue from 10 to 30 embryo axis of the same sampling time. Statistical significance was determined by a one-way ANOVA. Differences between S0 samples and between each other were statistically significant at the level ∗P < 0.05; ∗∗∗P < 0.001. (E,F) Western blotting of GAPDH and RBCL proteins in Q. ilex seed samples. Proteins were extracted from the same pools used in the transcriptional analysis. Numbers indicate the arbitrary Western blotting signal intensities normalized to the total protein contents, using Stain-Free Technology for total protein quantification. (G) A simplified working model of some metabolic pathways indicating the participation of the Gapdh, Nadh6, RbcL and Fdh gene products.

