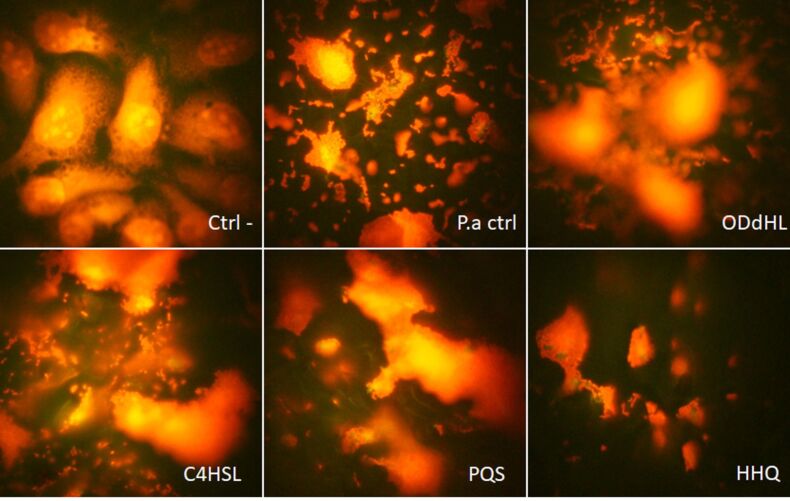
Figure 3.
Fluorescence microscopy images of QSSMs treated euckariote cells, revealing attachment patterns. (Ctrl- = untreated control cells, P.a ctrl = P. aeruginosa control treated cells, ODdHL = P. aeruginosa + OddHL treated cells, C4HSL = P. aeruginosa + C4HSL treated cells, PQS = P. aeruginosa + PQS treated cells, HHQ = P. aeruginosa + HHQ treated cells, ob. 100×, immersion oil.

