
FIGURE 3.
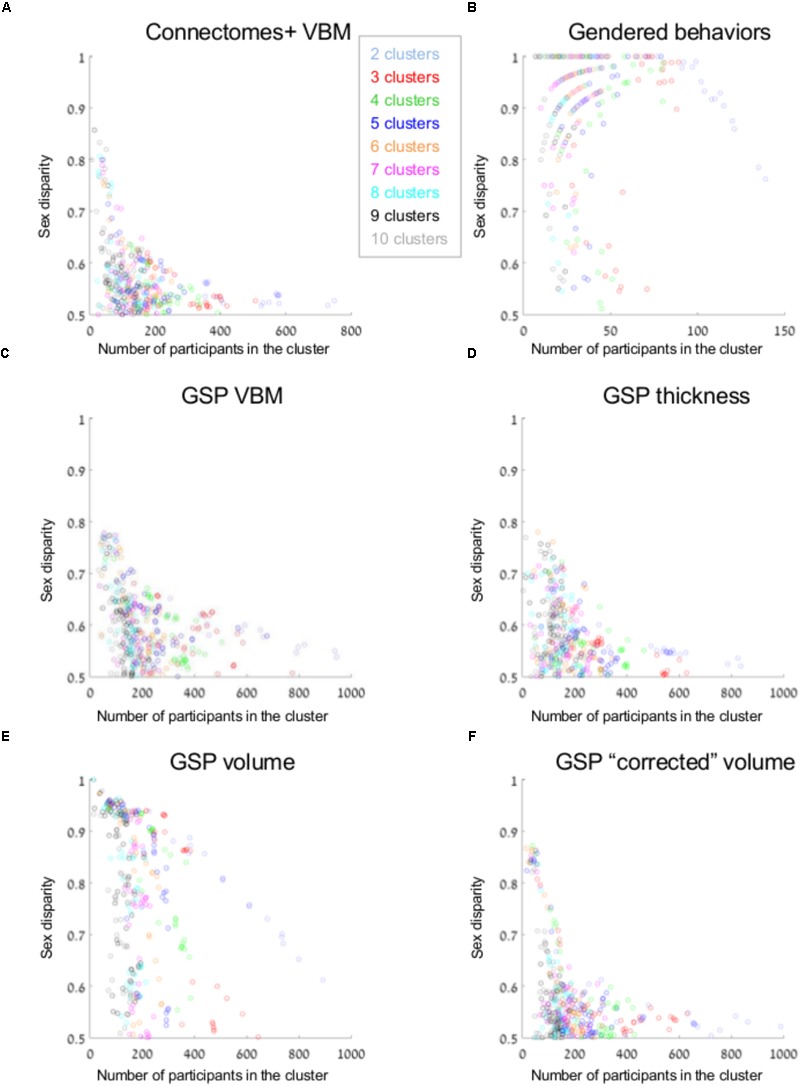
Unsupervised clustering: dividing into 2–10 clusters. (A–F) The sex disparity (i.e., the largest of the proportion of females and the proportion of males in a cluster, Y-axis) as a function of cluster’s size (X-axis) of every cluster, following divisions into 2–10 clusters (the number of clusters is marked with different colors) of the (A) Connectomes+ VBM data, (B) Carothers and Reis’ behavioral data, (C) GSP VBM data, (D) GSP cortical thickness data, (E) GSP volume data, and (F) GSP ICV-“corrected” volume data.