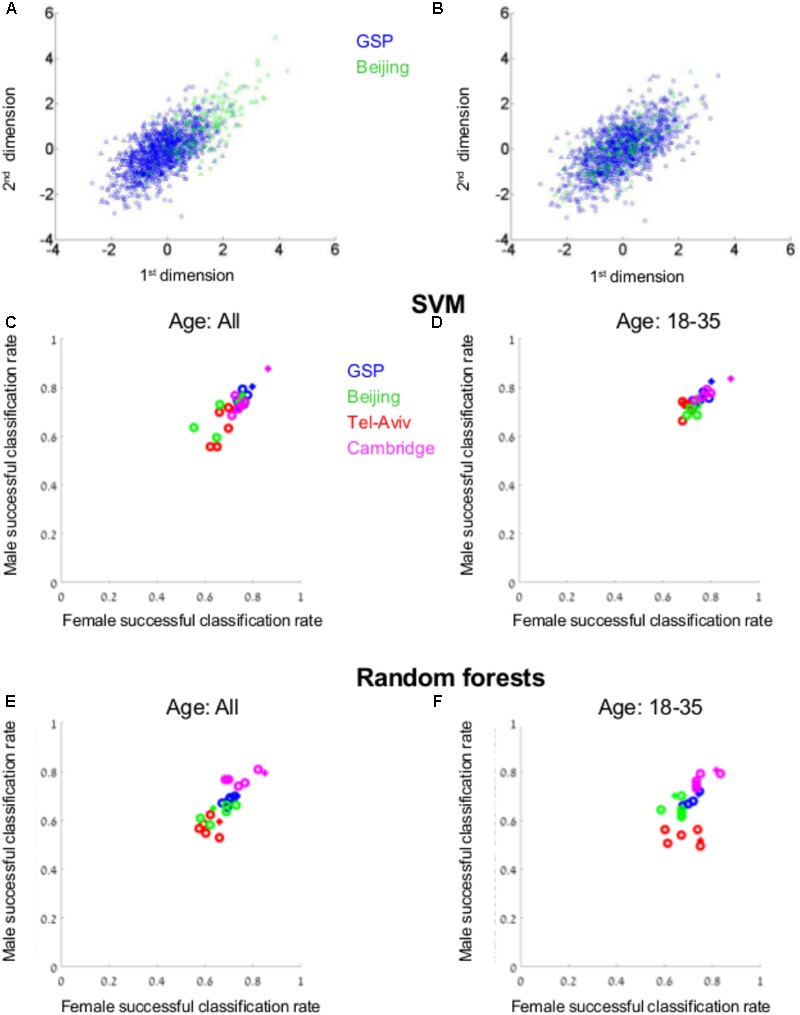
FIGURE 5.

Supervised clustering. (A) The distribution of brains from females (circles) and from males (triangles) from the GSP (blue) and Beijing (green) datasets following z-score transformation of the combined GSP and Beijing datasets (B) and when each dataset was transferred to z-scores prior to transferring the combined dataset into z-scores. (C–F) The percent of females (out of females, X-axis) and the percent of males (out of males, Y-axis) that were correctly classified as female or male, respectively, by a model created by SVM (C,D) or random forests (E,F) on the GSP VBM data, when the model was tested on the entire test dataset (C,E) or only on participants aged 18–35 years (D,F). The classification rates for the GSP data (blue dots) were calculated using 10-folds cross-validation. The classification rates for Tel-Aviv, Cambridge, and Beijing are marked in green, purple, and red, respectively. The z-scores transformation is marked with a plus.
