
FIGURE 6.
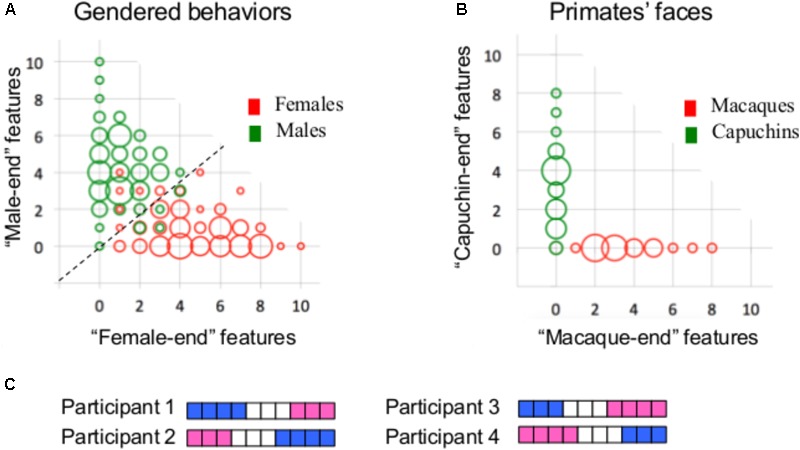
(A) A bivariate scattergram of the number of features at the “female-end” (X-axis) and at the “male-end” (Y-axis) in females (red) and males (green) in Carothers and Reis’ gender-stereotyped behavioral dataset. Using the actual distributions of males and females in the sample, a “male-end” and a “female-end” zones were arbitrarily defined as the scores of the 33% most extreme males and females, respectively, and an “intermediate” zone was defined as the area in-between these two (adapted from Joel et al., 2015). (B) Same as A, but for the 10 facial morphology features showing the largest differences between the two primate species. (C) An illustration of the gender mosaic in four hypothetical participants. Scores on the 10 gender stereotyped behaviors are represented using a pink–white–blue (“female-end”–“intermediate”–“male-end”) color code. Each horizontal line represents a single participant and each column represents a single behavior.