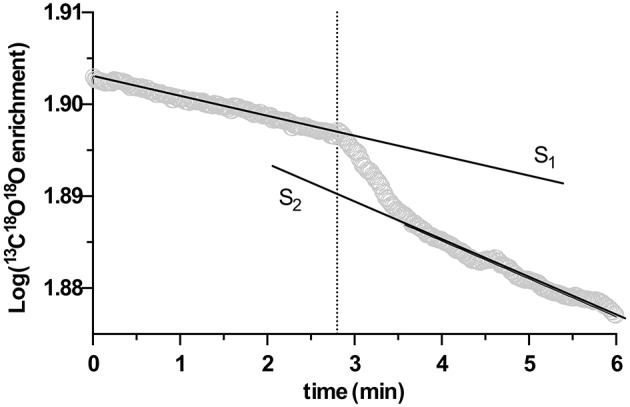
Figure 1.

An example of extracellular carbonic anhydrase (eCA) activity measurement with membrane inlet mass spectrometry (MIMS), performed in the dark. X-axis is time, Y-axis represents the log enrichment of 13C18O18O, calculated with Equation (1). At the time point indicated by the dotted line, biomass was injected. S1 and S2 depict the slopes of linear regressions performed on the rate of decay of log enrichment of 13C18O18O before and after biomass injection.
