
Figure 3.
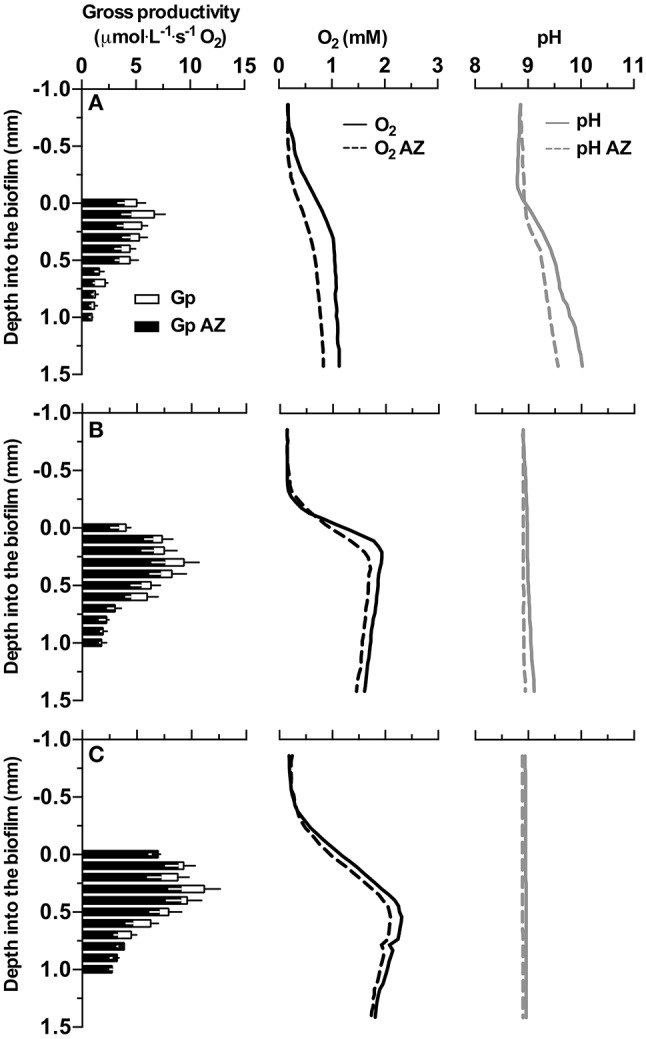
Profiles of gross photosynthetic activity (Gp), oxygen concentration, and pH measured with microsensors in the investigated biofilm. Row (A–C) give the profiles acquired from biofilms cultivated with medium supplemented with 0, 0.5, and 1 M dissolved inorganic carbon (DIC), respectively. Y-axes give the depth relative to the surface of the measured biofilm, 0 indicates the approximated position of the surface of the biofilm. Black bars represent Gp after AZ addition, empty bars show the difference of Gp before and after AZ addition. Solid lines represent profiles (i.e., O2, pH) before AZ addition, dashed lines represent profiles (i.e., O2, pH) after AZ addition. The data shown here are the mean values of 3 replicate measurements, for gross productivity, black and white error bars present the standard deviation for triplicates before and after AZ addition, respectively. Error bars for oxygen and pH measurements are omitted for clarity.