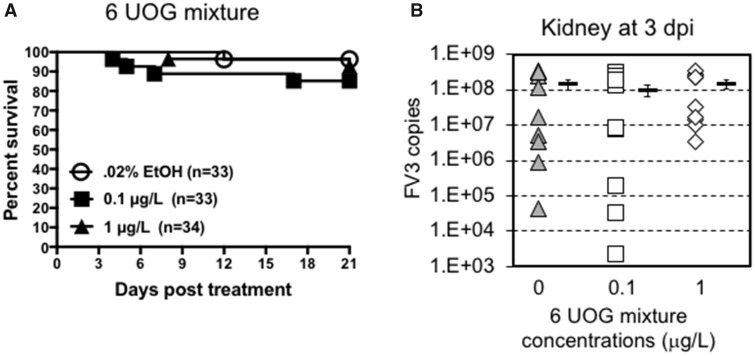
Figure 5.
A, Survival curve of tadpoles exposed for 3 weeks to 0.2% ethanol (vehicle control) or 0.1, or 1.0 μg/l of an equimass mixture of 6 UOG chemicals. Survival was monitored for 20 days following exposure during which tadpoles were checked daily. The data are pools of 2 independent experiments. No statistical significance (Log Rank Test). B, FV3 copy number 3 days after FV3 infection as determined by absolute qRT-PCR. For each group, the viral genome copy number of each individual is depicted by different symbol as well as a horizontal barre indicating the average ± SD. No statistical significance (ANOVA and Mann-Whitney U Test). n = 10 animals per group from 2 different experiments (5 per experiment).

