
Figure 2.
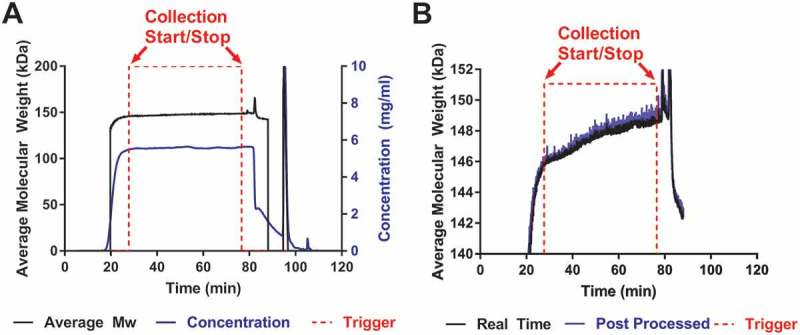
Real time MALS data from a HIC purification.
a). The concentration and Mw signals are plotted along with the trigger signals. Throughout the purification, there is an increase in Mw (—) as aggregates saturate the HIC column and dimers coelute with the monomers. The protein is eluted from the column and passes through both the UV and in-line MALS detectors. The Mw is calculated in < 1 s using both the UV and light scattering signal and a start/stop trigger (- - -) is sent to the purification unit when the protein meets the preset Mw criteria. The concentration is calculated from the UV detector of the purification unit (---). b) No significant differences were observed between the data from real time (—) and post processed modes of analysis (---).