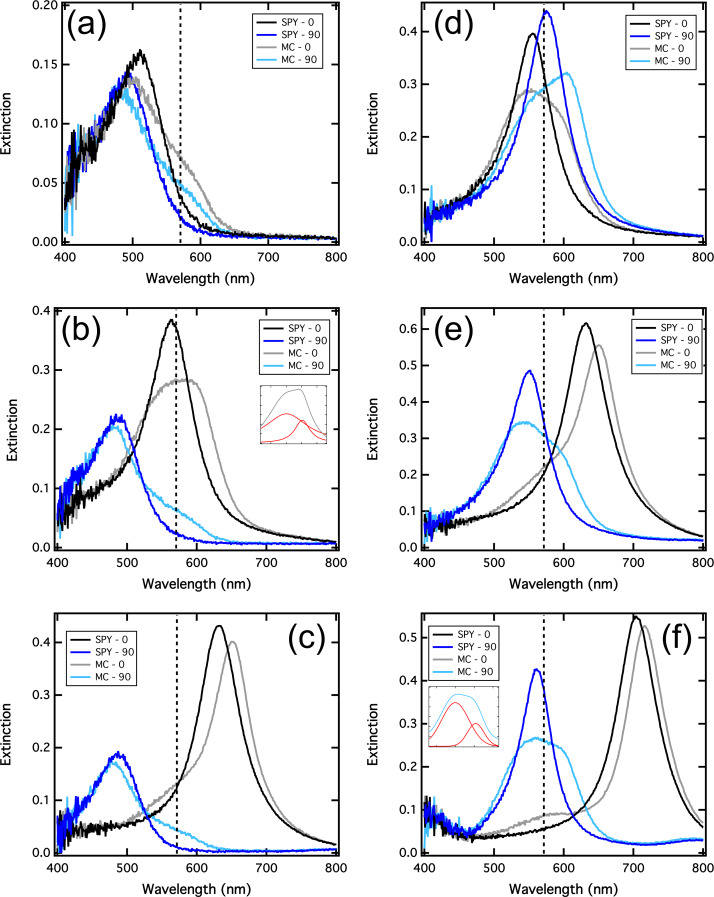
Figure 2.
Extinction spectra of the silver nanorod arrays covered with photochromic molecules before (in SPY) and after (in MC) the photochromic transition. The 0° and 90° polarization orientations, corresponding to the excitation of the long and the short axis, are in black/grey and in dark/light blue, respectively. (a), (b) and (c) are measurements on nanorods presenting a width of 70 nm and lengths of 70, 90 and 110 nm, respectively. (d), (e) and (f) are measurements on nanorods presenting a width of 90 nm and lengths of 90, 110 and 130 nm, respectively.

