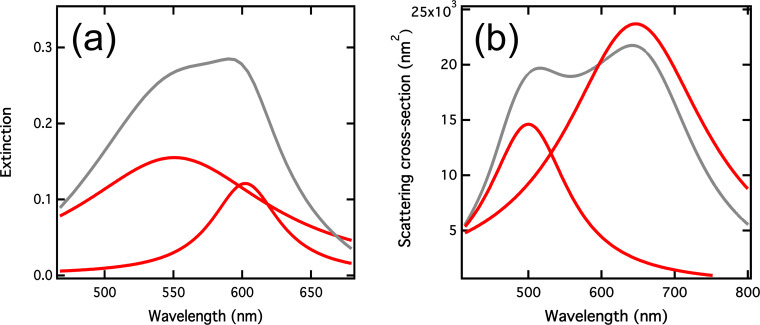
Figure 4.
(a) Extinction spectrum (grey curve) recorded with a 70 nm wide and 90 nm long nanorod array covered with the MC isomer. The red curves correspond to the Lorentzian fitted peaks. (b) Extinction cross-section and the fitted peak decomposition, calculated for an ellipsoid of the same dimensions.

